• High Power Laser Science and Engineering
  • Vol. 7, Issue 3, 03000e51 (2019)
G. Cristoforetti1、†, L. Antonelli2, D. Mancelli3、4, S. Atzeni5, F. Baffigi1, F. Barbato3, D. Batani3、6, G. Boutoux3、7, F. D’Amato1, J. Dostal8、9, R. Dudzak8、9, E. Filippov6、10, Y. J. Gu9、11, L. Juha8、9, O. Klimo12, M. Krus9, S. Malko13、14, A. S. Martynenko6、10, Ph. Nicolai3, V. Ospina13、14, S. Pikuz6、10, O. Renner8、11, J. Santos3, V. T. Tikhonchuk3、11, J. Trela3, S. Viciani1, L. Volpe13、14, S. Weber11, and L. A. Gizzi1
Author Affiliations
  • 1National Institute of Optics, CNR, Pisa and Florence, Italy
  • 2York Plasma Physics Institute, University of York, Heslington, York, UK
  • 3Université de Bordeaux, CNRS, CEA, CELIA, Talence, France
  • 4Donostia International Physics Center (DIPC), Donostia/San Sebastian, Basque Country, Spain
  • 5Dipartimento SBAI, Università di Roma La Sapienza, Roma, Italy
  • 6National Research Nuclear University MEPhI, Moscow, Russia
  • 7CEA, DAM, DIF, Arpajon, France
  • 8Department of Radiation and Chemical Physics, Institute of Physics of the CAS, Prague, Czech Republic
  • 9Laser Plasma Department, Institute of Plasma Physics of the CAS, Prague, Czech Republic
  • 10Joint Institute for High Temperature RAS, Moscow, Russia
  • 11ELI-Beamlines, Institute of Physics of the CAS, Prague, Czech Republic
  • 12FNSPE, Czech Technical University in Prague, Prague, Czech Republic
  • 13Universidad de Salamanca, Ctr Laseres Pulsados, Salamanca, Spain
  • 14Centro de Laseres Pulsados (CLPU), Villamayor, Salamanca, Spain
  • show less
    DOI: 10.1017/hpl.2019.37 Cite this Article Set citation alerts
    G. Cristoforetti, L. Antonelli, D. Mancelli, S. Atzeni, F. Baffigi, F. Barbato, D. Batani, G. Boutoux, F. D’Amato, J. Dostal, R. Dudzak, E. Filippov, Y. J. Gu, L. Juha, O. Klimo, M. Krus, S. Malko, A. S. Martynenko, Ph. Nicolai, V. Ospina, S. Pikuz, O. Renner, J. Santos, V. T. Tikhonchuk, J. Trela, S. Viciani, L. Volpe, S. Weber, L. A. Gizzi. Time evolution of stimulated Raman scattering and two-plasmon decay at laser intensities relevant for shock ignition in a hot plasma[J]. High Power Laser Science and Engineering, 2019, 7(3): 03000e51 Copy Citation Text show less
    Experimental setup used for the investigation of parametric instabilities.
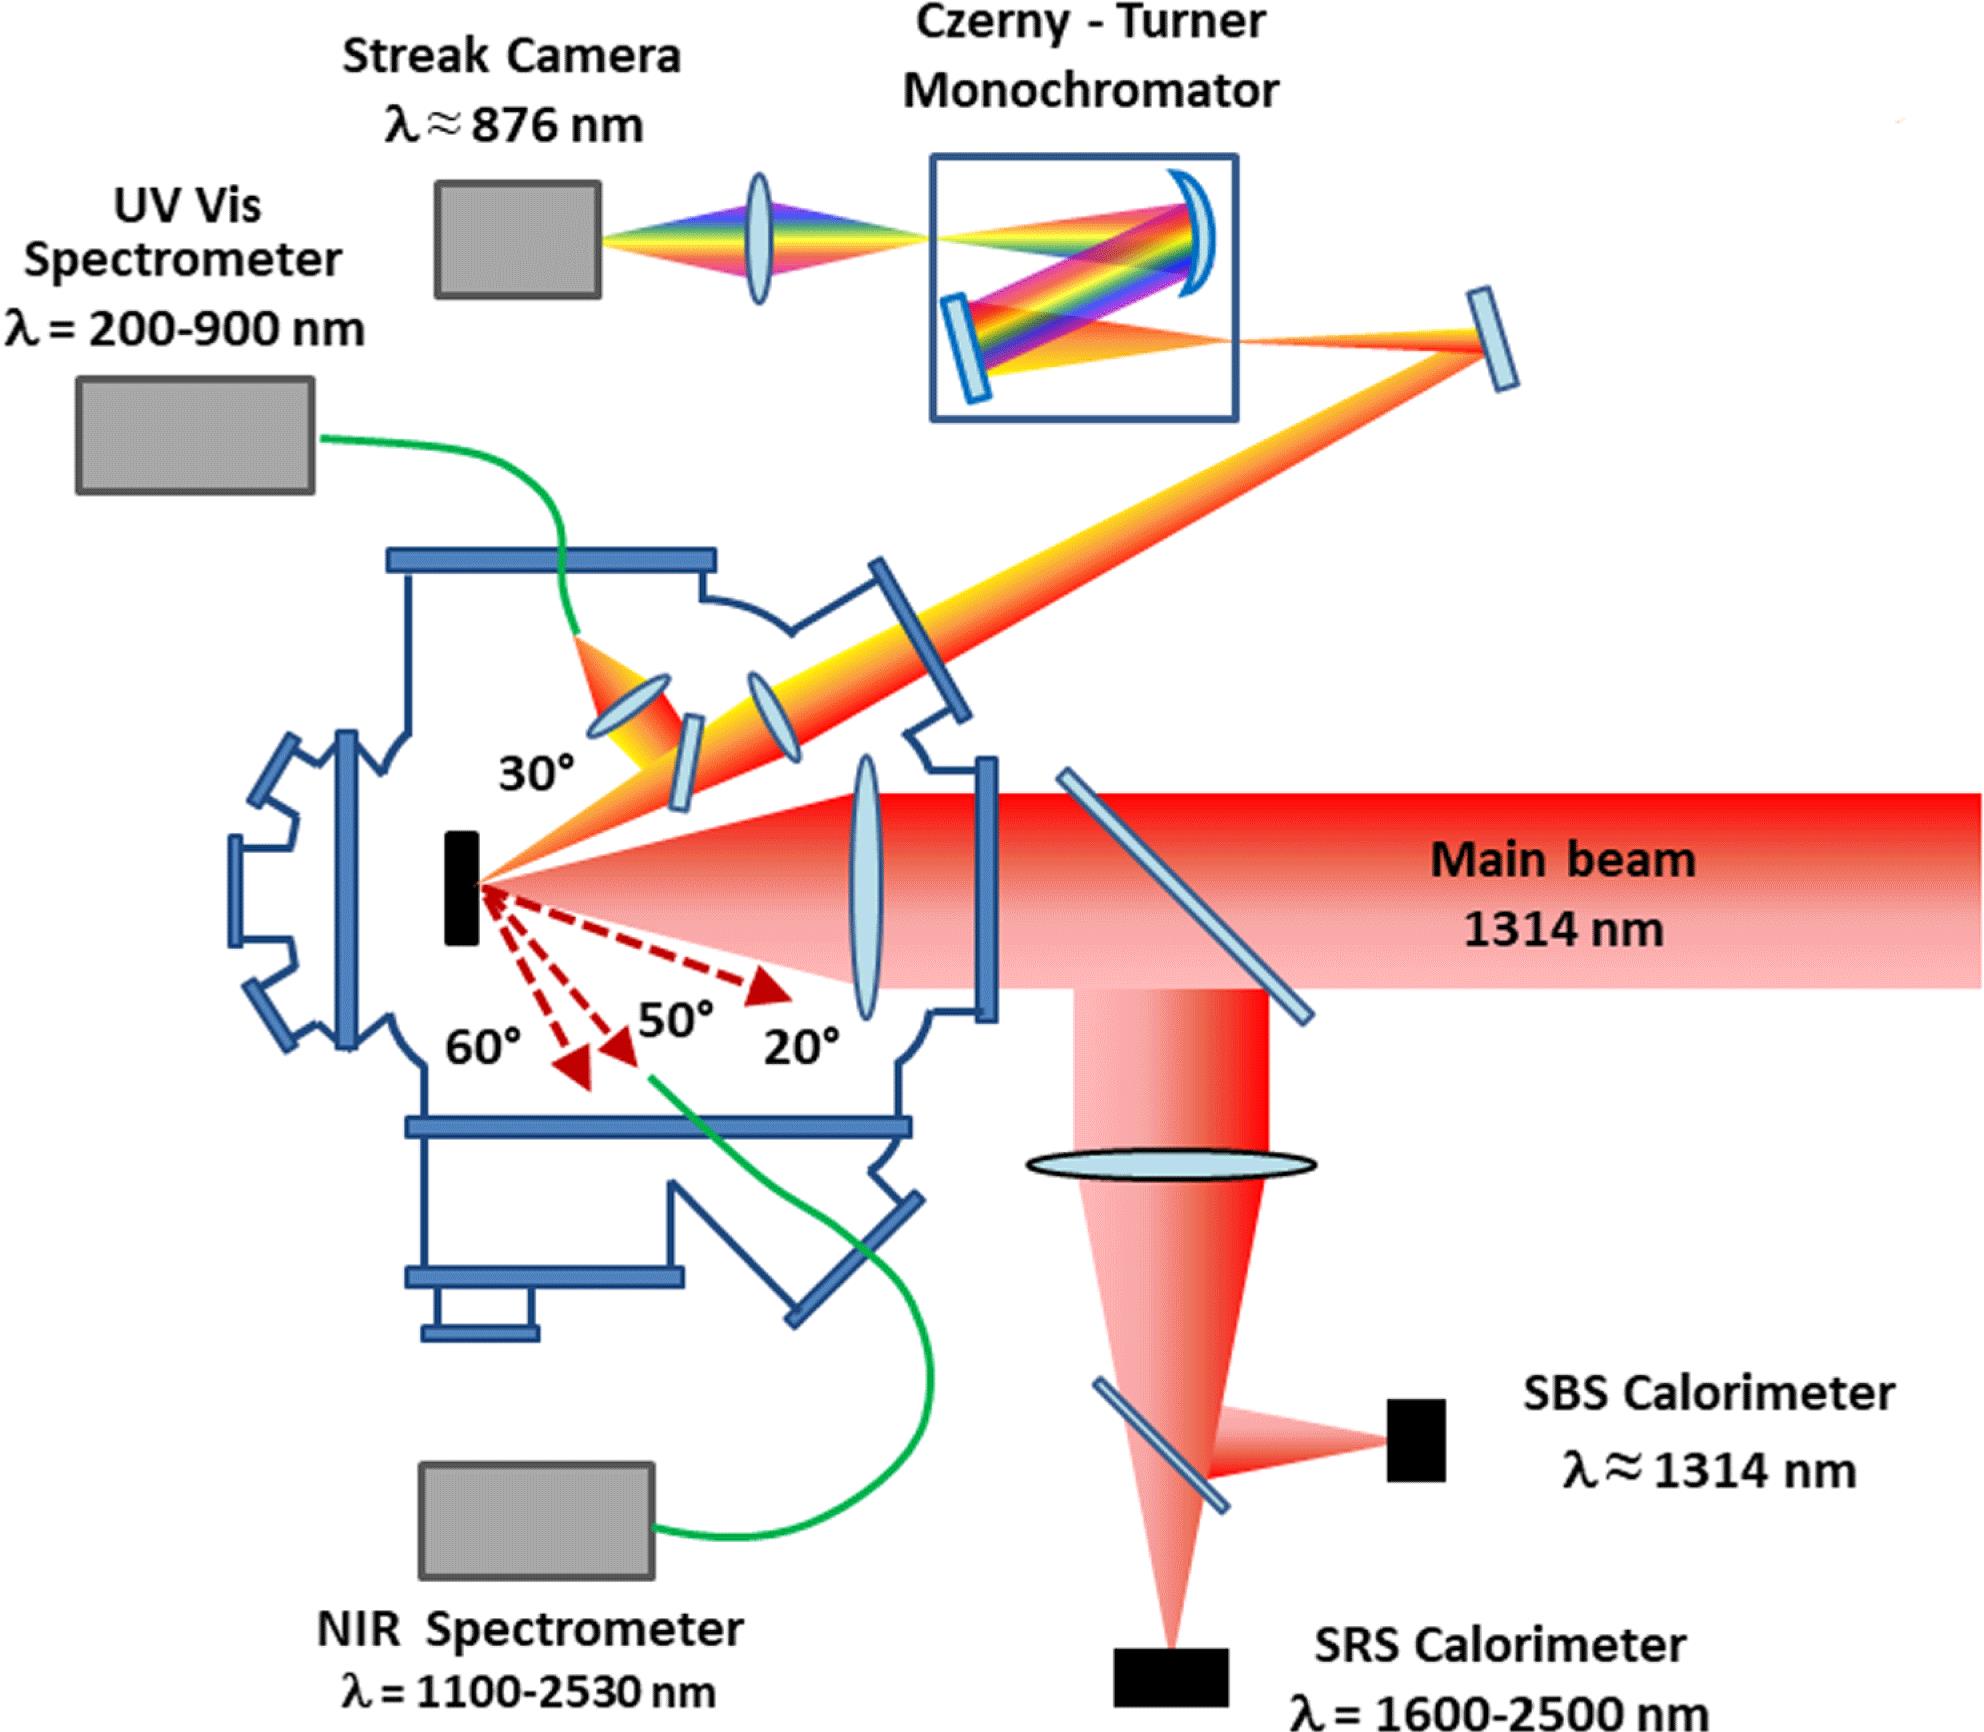
    Fig. 1. Experimental setup used for the investigation of parametric instabilities.
    Instantaneous values of electron temperature $T_{e}$ (red squares) and density scalelength $L$ (blue stars) in the density range $0.05{-}0.25\,n_{c}$, as obtained by CHIC hydrosimulations in the experimental conditions of the interaction. The dashed line indicates the laser pulse profile.
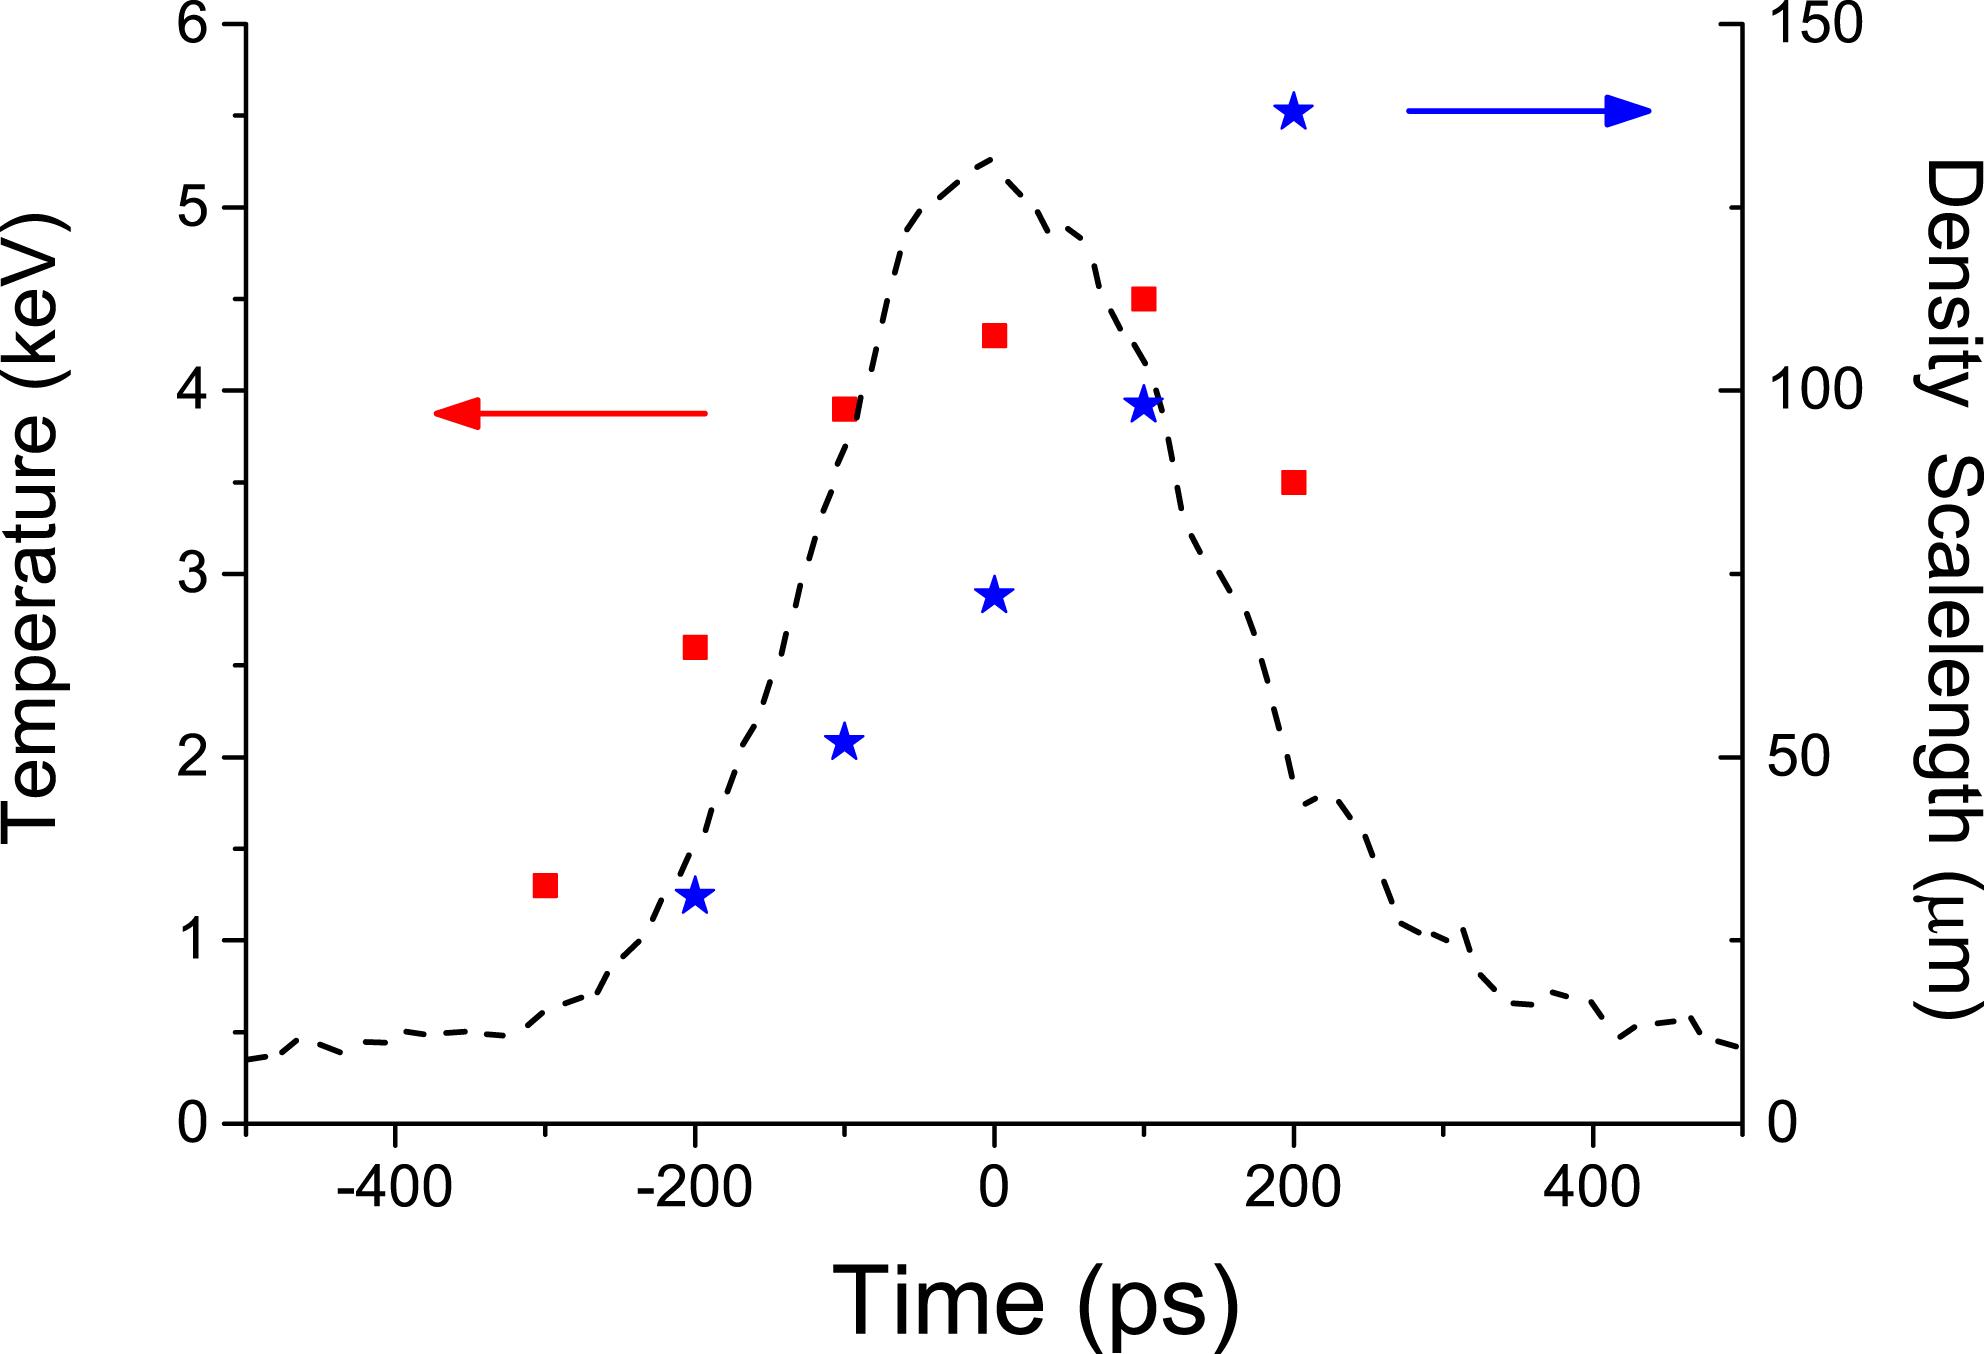
    Fig. 2. Instantaneous values of electron temperature $T_{e}$ (red squares) and density scalelength $L$ (blue stars) in the density range $0.05{-}0.25\,n_{c}$, as obtained by CHIC hydrosimulations in the experimental conditions of the interaction. The dashed line indicates the laser pulse profile.
    Typical time-integrated SRS spectra acquired at $\unicode[STIX]{x1D703}=20^{\circ }$ (BRS) and $\unicode[STIX]{x1D703}=50^{\circ }$ (SRSS).
    Fig. 3. Typical time-integrated SRS spectra acquired at $\unicode[STIX]{x1D703}=20^{\circ }$ (BRS) and $\unicode[STIX]{x1D703}=50^{\circ }$ (SRSS).
    Scheme of regions of density where parametric instabilities are driven.
    Fig. 4. Scheme of regions of density where parametric instabilities are driven.
    Time-integrated half-integer harmonic spectra plotted versus the shift with respect to their nominal frequency. Dashed, red and green lines correspond to the peaks produced by Thomson scattering with EPWs driven by TPD, BRS and SRSS, respectively.
    Fig. 5. Time-integrated half-integer harmonic spectra plotted versus the shift with respect to their nominal frequency. Dashed, red and green lines correspond to the peaks produced by Thomson scattering with EPWs driven by TPD, BRS and SRSS, respectively.
    Geometry of the Thomson up-scattering of $3\unicode[STIX]{x1D714}_{0}$ harmonic light with the EPW driven by SRSS at $n_{e}\approx 0.12\,n_{c}$. The dotted vectors refer to the up-scattering geometry involving the secondary EPW produced by LDI.
    Fig. 6. Geometry of the Thomson up-scattering of $3\unicode[STIX]{x1D714}_{0}$ harmonic light with the EPW driven by SRSS at $n_{e}\approx 0.12\,n_{c}$. The dotted vectors refer to the up-scattering geometry involving the secondary EPW produced by LDI.
    Time-resolved $3/2\unicode[STIX]{x1D714}_{0}$ spectra. The time spanned across the vertical axis is 500 ps, with a time resolution of 25 ps. The laser pulse profile is indicated by the red curve and the peak time by the yellow dashed line. The spectra on the right are obtained by the lineout in windows a, b and c.
    Fig. 7. Time-resolved $3/2\unicode[STIX]{x1D714}_{0}$ spectra. The time spanned across the vertical axis is 500 ps, with a time resolution of 25 ps. The laser pulse profile is indicated by the red curve and the peak time by the yellow dashed line. The spectra on the right are obtained by the lineout in windows a, b and c.
    Spectrum of backscattered light recorded in front of the target during the quasi-stationary stage of the interaction (5–9 ps). The frequency is normalized to the laser frequency $\unicode[STIX]{x1D714}_{0}$.
    Fig. 8. Spectrum of backscattered light recorded in front of the target during the quasi-stationary stage of the interaction (5–9 ps). The frequency is normalized to the laser frequency $\unicode[STIX]{x1D714}_{0}$.
    Distribution of the Poynting flux in the laser propagation direction (in units $\text{W}\,\cdot \,\text{cm}^{-2}$) averaged temporally over 3 ps during the quasi-steady stage of interaction and spatially over one laser wavelength. Red and blue colours represent therefore incident and backscattered light, respectively. The incident laser beam is propagating from the left and the black vertical lines show the position of the quarter critical and critical density surfaces. The black dashed line is shown to guide the eye for the opening angle of backward propagating light.
    Fig. 9. Distribution of the Poynting flux in the laser propagation direction (in units $\text{W}\,\cdot \,\text{cm}^{-2}$) averaged temporally over 3 ps during the quasi-steady stage of interaction and spatially over one laser wavelength. Red and blue colours represent therefore incident and backscattered light, respectively. The incident laser beam is propagating from the left and the black vertical lines show the position of the quarter critical and critical density surfaces. The black dashed line is shown to guide the eye for the opening angle of backward propagating light.
    Coll.SBS/laser BRSSRSS HE
    Abs. BackAll
    Experimental14%–20%0.6%–4% *5.3%
    PIC $\text{results}^{a}$30%$82\%^{b}$3%*10%
    CHIC simul. 9%$3.4\%^{c}$
    Table 1. Energy spent in different energy channels during the interaction. The * symbol indicates mechanisms which have been observed but not quantified
    G. Cristoforetti, L. Antonelli, D. Mancelli, S. Atzeni, F. Baffigi, F. Barbato, D. Batani, G. Boutoux, F. D’Amato, J. Dostal, R. Dudzak, E. Filippov, Y. J. Gu, L. Juha, O. Klimo, M. Krus, S. Malko, A. S. Martynenko, Ph. Nicolai, V. Ospina, S. Pikuz, O. Renner, J. Santos, V. T. Tikhonchuk, J. Trela, S. Viciani, L. Volpe, S. Weber, L. A. Gizzi. Time evolution of stimulated Raman scattering and two-plasmon decay at laser intensities relevant for shock ignition in a hot plasma[J]. High Power Laser Science and Engineering, 2019, 7(3): 03000e51
    Download Citation