
Wei Huang, Yulong Cui, Zhixian Li, Zhiyue Zhou, Zefeng Wang. 1.56 μm and 2.86 μm Raman lasers based on gas-filled anti-resonance hollow-core fiber[J]. Chinese Optics Letters, 2019, 17(7): 071406
- Chinese Optics Letters
- Vol. 17, Issue 7, 071406 (2019)
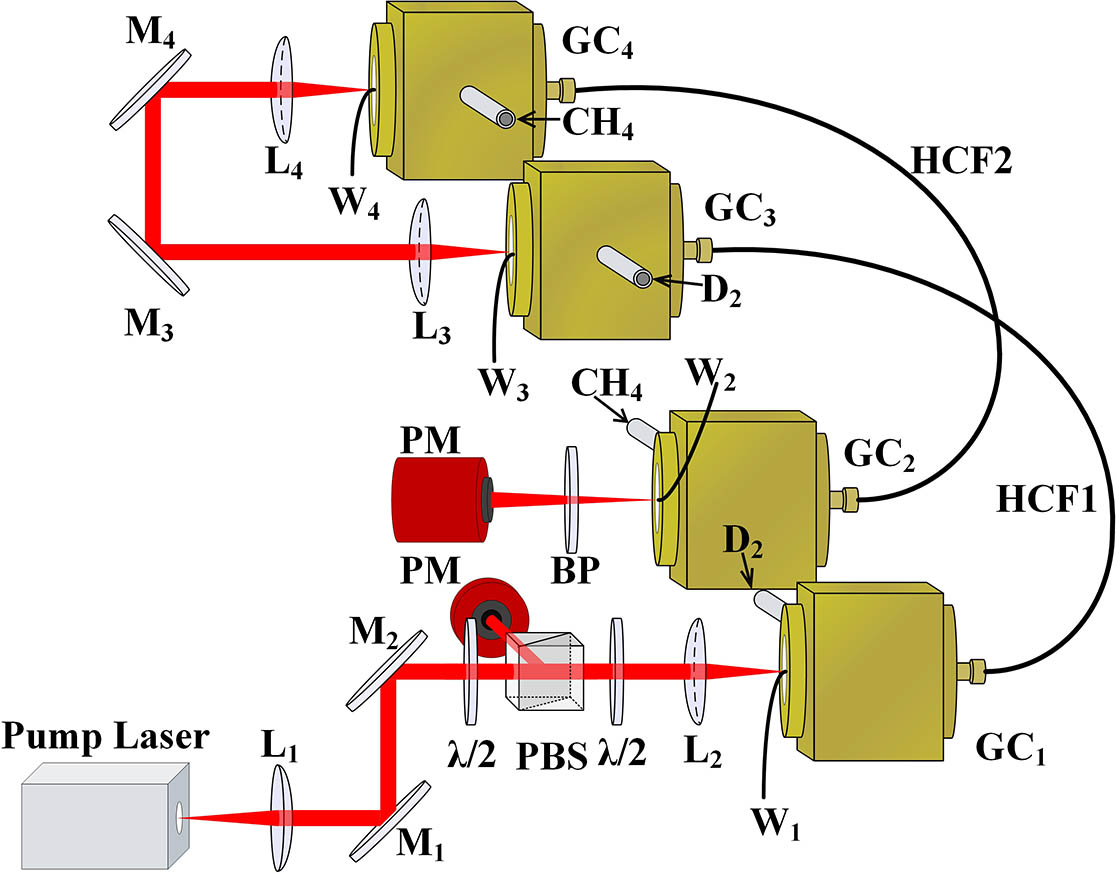
Fig. 1. Experimental setup: M, coated high-reflection mirror;
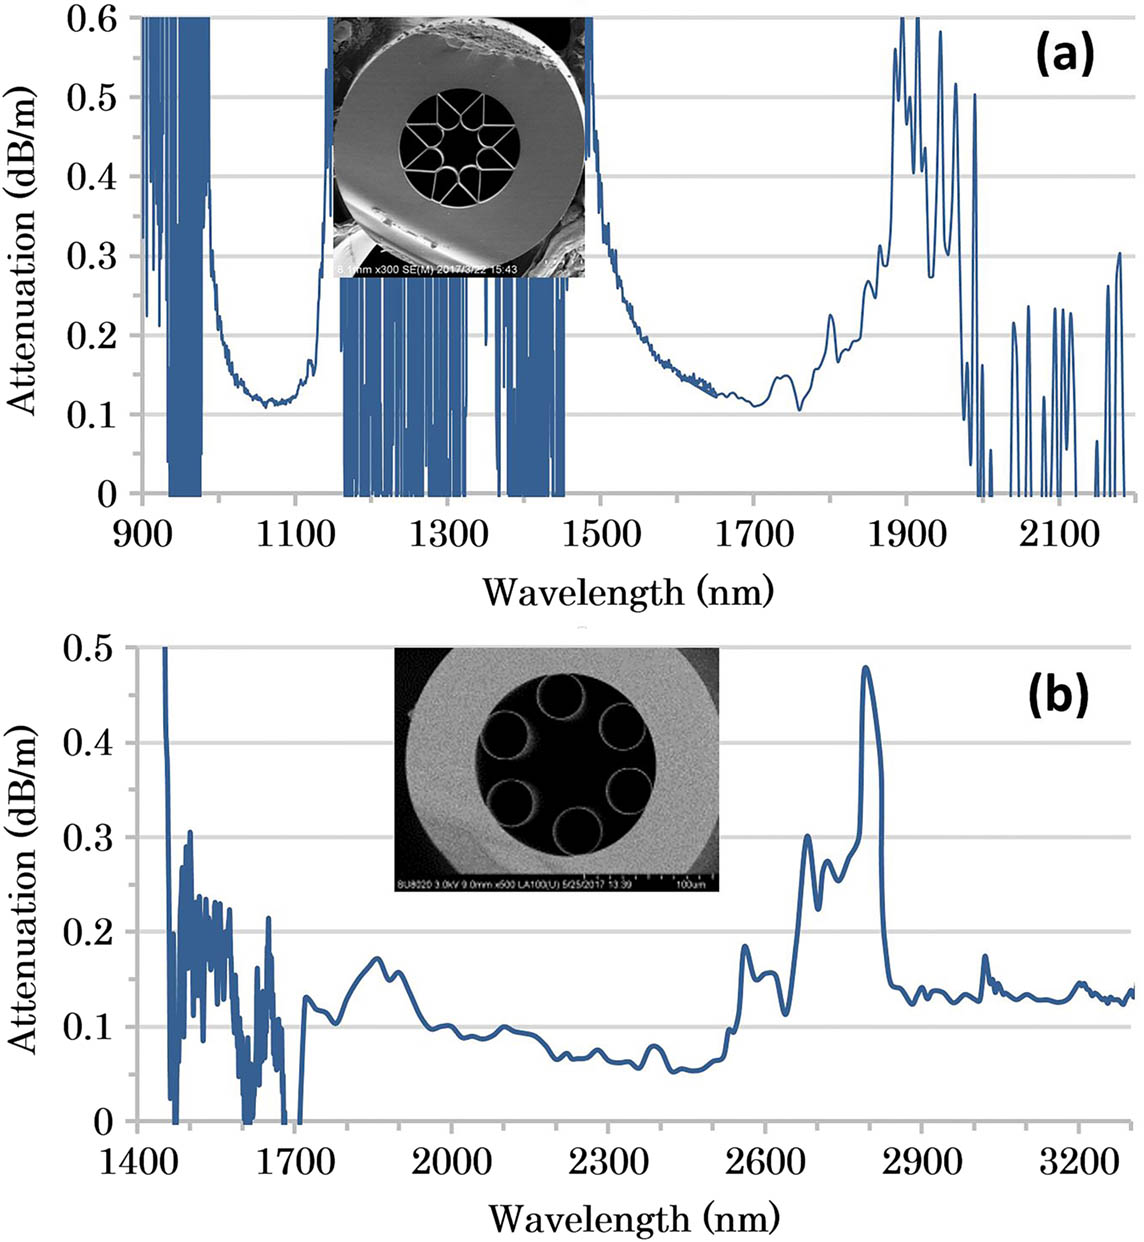
Fig. 2. Transmission spectra of (a) HCF1 and (b) HCF2 measured with the cut-off method. Insets: the scanning electron micrographs of the HCFs’ cross sections.
Fig. 3. Measured optical spectra of 2 m deuterium-filled HCFs with different gas pressure and coupled pump power. VS, vibrational Stokes; VAS, vibrational anti-Stokes; RS, rotational Stokes; RAS, rotational anti-Stokes. VS1: 1560.9 nm; VAS1: 807.5 nm; VAS2: 650.5 nm; VAS3: 544.6 nm; RS1: 1113.6 nm; RAS1: 1019.4 nm;
Fig. 4. Measured (a) pump and (b) Stokes pulse shape using a fast detector and a broad bandwidth oscilloscope with a 2 m HCF filled with 4 bar of deuterium gas.
Fig. 5. (a) Output power and (b) Raman conversion efficiency at 1560.9 nm in a 2 m HCF change with incident pump power and deuterium pressure in the first stage.
Fig. 6. Measured spectrum of the output of HCF2 in the second stage, measured with 2.2 m fiber length and 12 bar methane pressure. The change of the noise level at 1500 nm is due to the change of the OSAs, so the relative intensities should be taken only as indicative. Inset: measured fine spectrum near 1064.6 nm (left), 1560.9 nm (middle), and 2865.5 nm (right), respectively, with an OSA resolution of 0.02 nm.
Fig. 7. (a) Output power and (b) Raman conversion efficiency at 2865.5 nm in a 2.2 m HCF changing with incident 1560.9 nm power and methane pressure in the second stage.

Set citation alerts for the article
Please enter your email address
© Copyright 2018-2021 | Chinese Laser Press. All Rights Reserved 沪ICP备15018463号-20