• Geographical Research
  • Vol. 39, Issue 7, 1534 (2020)
Xiaojun HUANG1、2、3、4、*, Bo WANG1, Mengmeng LIU1, Yuhui GUO1, and Yanyu LI1
Author Affiliations
  • 1College of Urban and Environmental Sciences, Northwest University, Xi’an 710127, China
  • 2Shaanxi Key Laboratory of Earth Surface System and Environmental Carrying Capacity, Xi’an 710127, China
  • 3Institute of Earth Surface System and Hazards, Northwest University, Xi’an 710127, China
  • 4Shaanxi Xi’an Urban Forest Ecosystem Research Station, Xi’an 710127, China
  • show less
    DOI: 10.11821/dlyj020190608 Cite this Article
    Xiaojun HUANG, Bo WANG, Mengmeng LIU, Yuhui GUO, Yanyu LI. Characteristics of urban extreme heat and assessment of social vulnerability in China[J]. Geographical Research, 2020, 39(7): 1534 Copy Citation Text show less
    Distribution of main cities and national meteorological stations in China
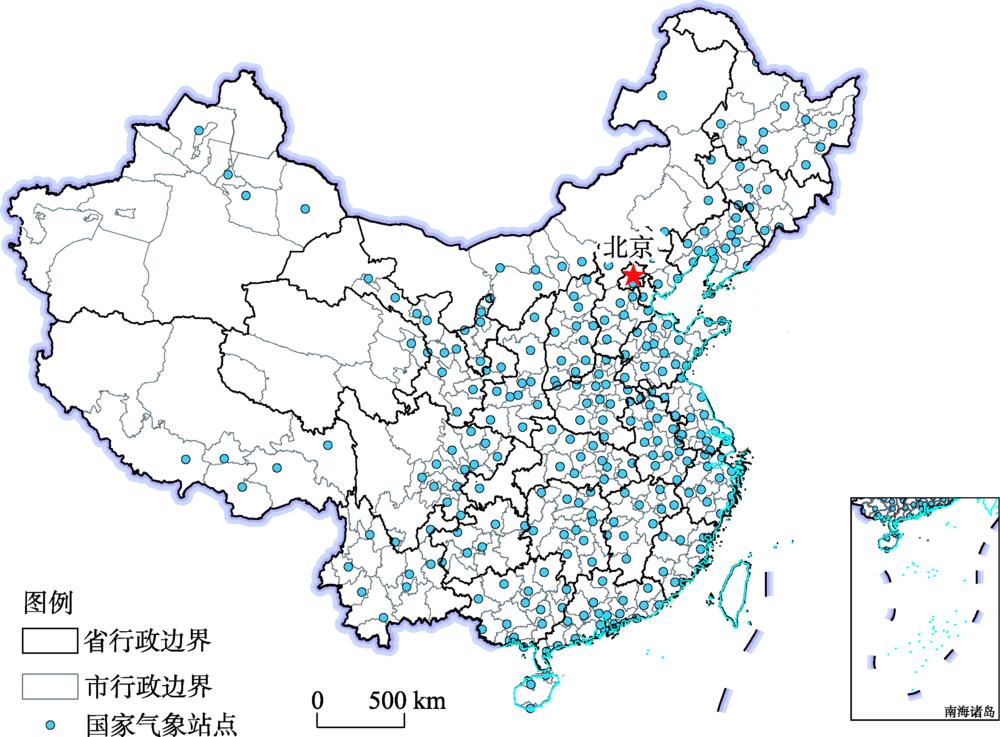
    Fig. 1. Distribution of main cities and national meteorological stations in China
    The analytical framework of urban social vulnerability to heat wave
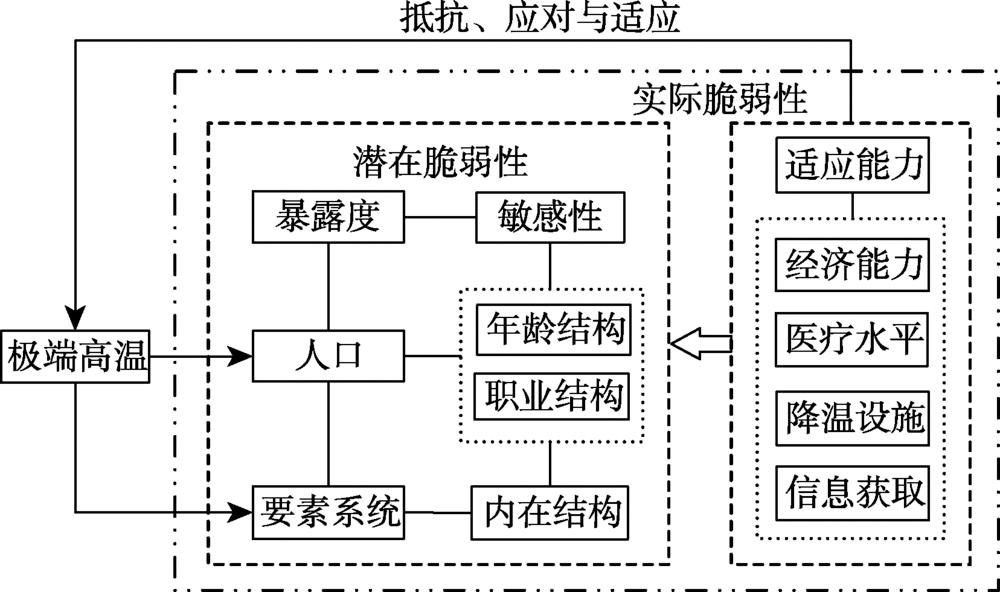
    Fig. 2. The analytical framework of urban social vulnerability to heat wave
    Days of urban high temperature in China from 1960 to 2016
    Fig. 3. Days of urban high temperature in China from 1960 to 2016
    Frequency of urban heat waves in China from 1960 to 2016
    Fig. 4. Frequency of urban heat waves in China from 1960 to 2016
    Duration of urban heat wave in China from 1960 to 2016
    Fig. 5. Duration of urban heat wave in China from 1960 to 2016
    Urban high temperature and heat wave intensity in China from 1960 to 2016
    Fig. 6. Urban high temperature and heat wave intensity in China from 1960 to 2016
    The index distribution of exposure, sensitivity, adaptive capacity and social vulnerability to heat wave in China
    Fig. 7. The index distribution of exposure, sensitivity, adaptive capacity and social vulnerability to heat wave in China
    The types and index contribution degree of urban social vulnerability to heat wave
    Fig. 8. The types and index contribution degree of urban social vulnerability to heat wave
    Distribution of urban social vulnerability types to heat wave in China
    Fig. 9. Distribution of urban social vulnerability types to heat wave in China
    高温指标单位指标释义
    高温日数日最高气温≥ 35℃的天数
    高温强度高温日(≥ 35℃)的最高气温平均值
    热浪频次高温热浪事件(连续3天≥ 35℃)发生的次数
    热浪持续时间高温热浪过程持续的总天数
    热浪强度高温热浪过程中日最高气温超过高温阈值(35℃)的累积数(气温累积值)
    Table 1. Index of urban high temperature and heat wave
    目标层维度层指标层指标权重指标释义
    高温社会脆弱性暴露度高温日数(天)0.1706日最高气温≥ 35℃的天数
    高温强度(℃)0.0179高温日的最高气温的平均值
    热浪频次(次)0.1841高温热浪事件发生的次数
    热浪持续时间(天)0.2314高温热浪过程持续的总天数
    热浪强度(℃)0.3050热浪过程中日最高气温≥ 35℃的气温累积数
    常住人口(万人)0.0910暴露于极端高温的人口规模
    敏感性5岁以下人口比例(%)0.1782反映儿童的敏感特征
    65岁以上人口比例(%)0.1178反映老年人口的敏感特征
    建筑业从业人口比例(%)0.7040反映户外工作人员的敏感特征
    适应能力初中以上学历人口比例(%)0.0964人口高温认知水平和应对能力的替代指标
    居民家庭人均可支配收入(元)0.0350家庭是否有降温设备及其数量的替代指标
    失业率(%)0.0157家庭是否有降温设备及其数量的替代指标
    每万人病床数(张)0.0647应对高温灾害健康保障水平的替代指标
    每万人医生数量(人)0.1198应对高温灾害健康保障水平的替代指标
    移动电话用户比例(%)0.0503人口获取高温预警信息能力的替代指标
    住房内有洗澡设施户比例(%)0.1397家庭是否有降温设施的替代指标
    人均供水量(m30.1913城市应对高温的设施水平的替代指标
    人均绿地面积(m20.2871城市应对高温的设施水平的替代指标
    Table 2. Evaluation index system of urban social vulnerability to heat wave
    脆弱性城市类型暴露度指数贡献度均值敏感性指数贡献度均值适应能力指数贡献度均值
    高社会脆弱性城市47.5339.6712.80
    中社会脆弱性城市37.6640.2422.10
    低社会脆弱性城市30.2839.3730.35
    Table 3. Average contribution of three indexes of different social vulnerable cities
    Xiaojun HUANG, Bo WANG, Mengmeng LIU, Yuhui GUO, Yanyu LI. Characteristics of urban extreme heat and assessment of social vulnerability in China[J]. Geographical Research, 2020, 39(7): 1534
    Download Citation