• Acta Physica Sinica
  • Vol. 69, Issue 9, 094101-1 (2020)
Shuai Ha1, Wen-Ming Zhang1, Yi-Ming Xie1, Peng-Fei Li1, Bo Jin1, Ben Niu1, Long Wei1, Qi Zhang1、2, Zhong-Lin Liu1, Yue Ma3, Di Lu4, Cheng-Liang Wan1, Ying Cui1, Peng Zhou1, Hong-Qiang Zhang1、*, and Xi-Meng Chen1、*
Author Affiliations
  • 1School of Nuclear Science and Technology, Lanzhou University, Lanzhou 730000, China
  • 2School of Nuclear Engineering and Technology, North China Electric Power University, Beijing 102206, China
  • 3RIKEN Nishina Center, RIKEN, Wako 351-0198, Japan
  • 4Department of Physics, University of Gothenburg, SE-41296 Gothenburg, Sweden
  • show less
    DOI: 10.7498/aps.69.20190933 Cite this Article
    Shuai Ha, Wen-Ming Zhang, Yi-Ming Xie, Peng-Fei Li, Bo Jin, Ben Niu, Long Wei, Qi Zhang, Zhong-Lin Liu, Yue Ma, Di Lu, Cheng-Liang Wan, Ying Cui, Peng Zhou, Hong-Qiang Zhang, Xi-Meng Chen. Transmission of low-energy Cl ions through Al2O3 insulating nanocapillaries [J]. Acta Physica Sinica, 2020, 69(9): 094101-1 Copy Citation Text show less
    Schematic diagram of experimental setup and the observation angle ϕ
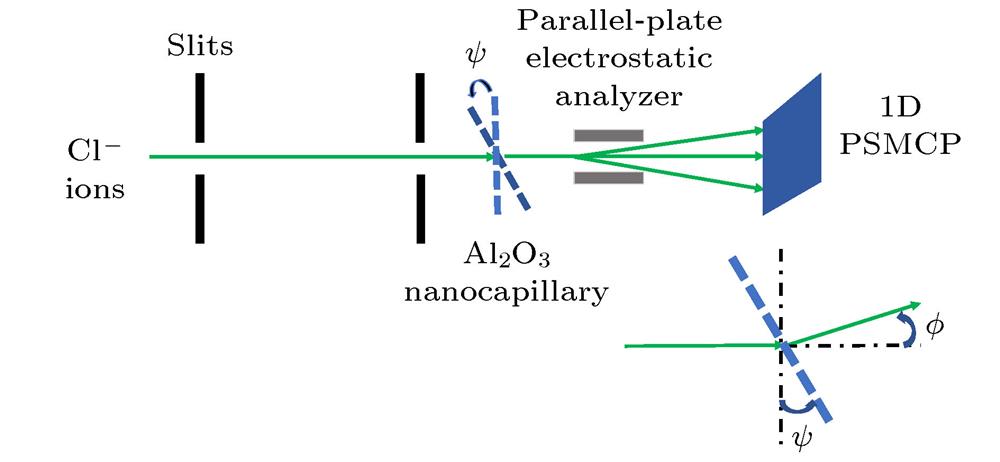
    Fig. 1. Schematic diagram of experimental setup and the observation angle ϕ
    Scanning electron microscope images of Al2O3 nanocapillaries.
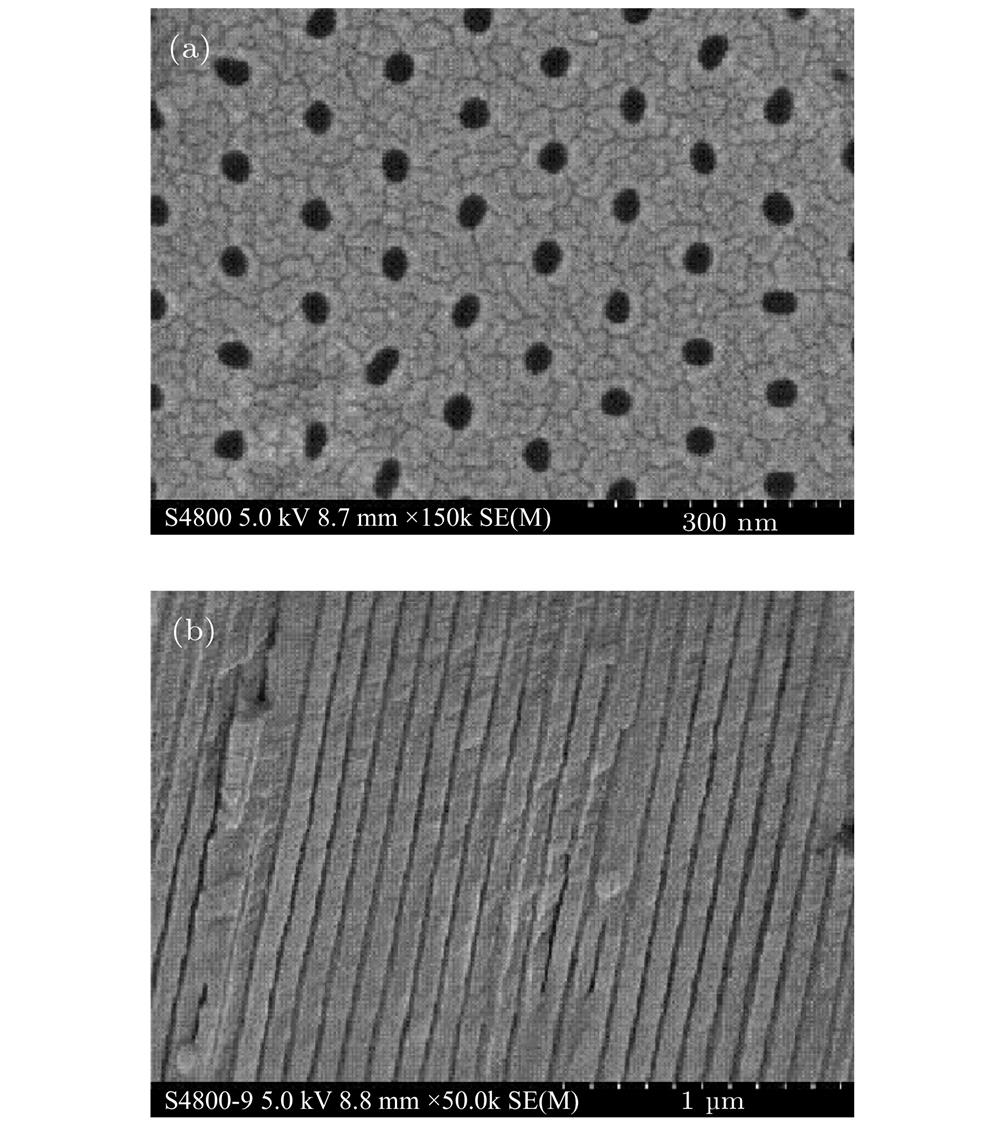
    Fig. 2. Scanning electron microscope images of Al2O3 nanocapillaries.
    (a) Calculated transmitted angular distributions for 10 keV-Cl– ions at various tile angles ψ (black lines for no deposited charge and red line for deposited charge of –100 e/capillary); (b) the experimental transmitted angular distributions for 10 keV-Cl– ions at various tile angles ψ.
    Fig. 3. (a) Calculated transmitted angular distributions for 10 keV-Cl ions at various tile angles ψ (black lines for no deposited charge and red line for deposited charge of –100 e/capillary); (b) the experimental transmitted angular distributions for 10 keV-Cl ions at various tile angles ψ.
    Exerting electrostatic field, (a) thecalculated charge state distributions of transmitted projectiles for 10 keV-Cl– at various tilt angles ψ (black line for no deposited charge and red line for deposited charge of –100 e/capillary); (b) the experimental charge state distributions of transmitted projectiles for 10 keV-Cl– at various tilt angles ψ.
    Fig. 4. Exerting electrostatic field, (a) thecalculated charge state distributions of transmitted projectiles for 10 keV-Cl at various tilt angles ψ (black line for no deposited charge and red line for deposited charge of –100 e/capillary); (b) the experimental charge state distributions of transmitted projectiles for 10 keV-Cl at various tilt angles ψ.
    Peak position of experimental and simulated angular distribution of transmitted neutrals (Cl0) as a function of the tilt angle. The solid line is the linear function that shows the peak position of transmitted neutral shifts according to the tilt angle.
    Fig. 5. Peak position of experimental and simulated angular distribution of transmitted neutrals (Cl0) as a function of the tilt angle. The solid line is the linear function that shows the peak position of transmitted neutral shifts according to the tilt angle.
    (a) Relative intensity of transmitted Cl–, Cl0 and Cl+ vs. the tilt angle ψ for 10 keV-Cl– ions; (b) the logarithm scale of the relative intensity of transmitted Cl0 and Cl+ as a function of the tilt angle ψ
    Fig. 6. (a) Relative intensity of transmitted Cl, Cl0 and Cl+ vs. the tilt angle ψ for 10 keV-Cl ions; (b) the logarithm scale of the relative intensity of transmitted Cl0 and Cl+ as a function of the tilt angle ψ
    Intensity ratio of transmitted Cl+ to Cl0 vs. the tilt angle ψ for the incident ions of 10 keV-Cl–. The red solid circle corresponds to the experimental results; black solid square corresponds to the simulation results; blue dash line indicates the angle within which the geometrical transmission occurs.
    Fig. 7. Intensity ratio of transmitted Cl+ to Cl0 vs. the tilt angle ψ for the incident ions of 10 keV-Cl. The red solid circle corresponds to the experimental results; black solid square corresponds to the simulation results; blue dash line indicates the angle within which the geometrical transmission occurs.
    Scattered angular distribution at the incident angle of 0.6° to the surface given by Firsov formula.
    Fig. 8. Scattered angular distribution at the incident angle of 0.6° to the surface given by Firsov formula.
    Schematic diagram of Cl– ions transmitted through a nanocapillary. The green line is a schematic diagram of the direct transmission of ions, the red line is a schematic diagram of ions transmitted by single scattering, and the black line is a schematic diagram of ions transmitted by double scattering.
    Fig. 9. Schematic diagram of Cl ions transmitted through a nanocapillary. The green line is a schematic diagram of the direct transmission of ions, the red line is a schematic diagram of ions transmitted by single scattering, and the black line is a schematic diagram of ions transmitted by double scattering.
    Schematic diagram of charge state exchange during transmission.
    Fig. 10. Schematic diagram of charge state exchange during transmission.
    Two dimensional transmitted angular distributions (a) and corresponding projections (b) of various charge states at tilt angle of 1.2° from simulations.
    Fig. 11. Two dimensional transmitted angular distributions (a) and corresponding projections (b) of various charge states at tilt angle of 1.2° from simulations.
    (a) Two-dimensional transmitted angular distributions and (b) corresponding projections of transmitted Cl0 exited from the capillaries by single scattering and double scattering and the total of them at tilt angle of 1.2° from simulations.
    Fig. 12. (a) Two-dimensional transmitted angular distributions and (b) corresponding projections of transmitted Cl0 exited from the capillaries by single scattering and double scattering and the total of them at tilt angle of 1.2° from simulations.
    Portions of various charge states in transmitted projectiles as a function of the tilt angle. E and S stand for the results from experiments and simulations, respectively.
    Fig. 13. Portions of various charge states in transmitted projectiles as a function of the tilt angle. E and S stand for the results from experiments and simulations, respectively.
    Portions of transmitted Cl0 for various scattering at the tilt angle of 0.8°, 1.2°, 1.6°. The black bars stand for single scattering, the red bars for double scattering, and the blue bars for those scattered three times from simulations.
    Fig. 14. Portions of transmitted Cl0 for various scattering at the tilt angle of 0.8°, 1.2°, 1.6°. The black bars stand for single scattering, the red bars for double scattering, and the blue bars for those scattered three times from simulations.
    Shuai Ha, Wen-Ming Zhang, Yi-Ming Xie, Peng-Fei Li, Bo Jin, Ben Niu, Long Wei, Qi Zhang, Zhong-Lin Liu, Yue Ma, Di Lu, Cheng-Liang Wan, Ying Cui, Peng Zhou, Hong-Qiang Zhang, Xi-Meng Chen. Transmission of low-energy Cl ions through Al2O3 insulating nanocapillaries [J]. Acta Physica Sinica, 2020, 69(9): 094101-1
    Download Citation