• Acta Photonica Sinica
  • Vol. 49, Issue 3, 0330003 (2020)
Fu-chun JIANG1, Si-yu HE1, Yuan-hai LIU1, Wen LIU1, Guang-yue CHAI2, Zhi-gang ZHAO2, and Bai-kui LI1
Author Affiliations
  • 1Key Laboratory of Optoelectronic Devices and Systems of Ministry of Education and Guangdong Province, College of Physics and Optoelectronic Engineering, Shenzhen University, Shenzhen, Guangdong 518060, China
  • 2College of New Materials and New Energy, Shenzhen Technology University, Shenzhen, Guangdong 518000, China
  • show less
    DOI: 10.3788/gzxb20204903.0330003 Cite this Article
    Fu-chun JIANG, Si-yu HE, Yuan-hai LIU, Wen LIU, Guang-yue CHAI, Zhi-gang ZHAO, Bai-kui LI. A Measurement Method Based on Characteristic Spectral Parameter for Determining Junction Temperature of LED[J]. Acta Photonica Sinica, 2020, 49(3): 0330003 Copy Citation Text show less
    Spectrogram of WLED with YAG phosphor
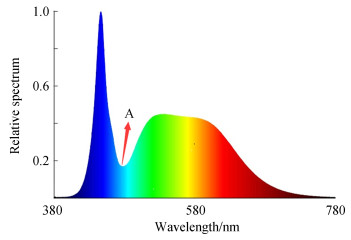
    Fig. 1. Spectrogram of WLED with YAG phosphor
    The schematic and physic diagram of LED junction temperature measurement system based on spectral parameters
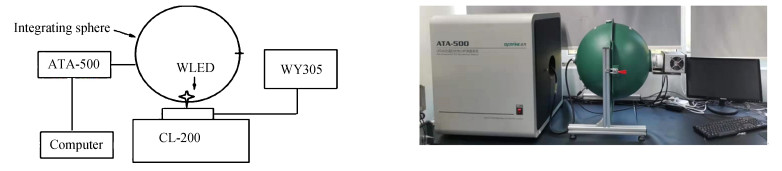
    Fig. 2. The schematic and physic diagram of LED junction temperature measurement system based on spectral parameters
    Spectrogram of WLED with high color temperature
    Fig. 3. Spectrogram of WLED with high color temperature
    Tj-I calibration function curve of WLED with high color temperature
    Fig. 4. Tj-I calibration function curve of WLED with high color temperature
    ΔTj-ΔI calibration function curve of WLED with high color temperature
    Fig. 5. ΔTjI calibration function curve of WLED with high color temperature
    Spectrogram of WLED with low color temperature
    Fig. 6. Spectrogram of WLED with low color temperature
    ΔTj-ΔI calibration function curve of WLED with low color temperature
    Fig. 7. ΔTjI calibration function curve of WLED with low color temperature
    Tj/℃510152025303540455055606570758085
    I/%9.9410.1710.5410.8911.2311.5411.912.2512.612.9513.3613.7314.1314.4814.8315.3415.76
    Table 1. Relative strength of spectral trough of WLED with high color temperature at different temperatures
    ΔTj/℃-20-15-10-5051015202530354045505560
    ΔI/%-1.29-1.06-0.69-0.3400.310.671.021.371.722.132.52.93.253.64.114.53
    Table 2. The difference of relative intensity of spectral trough of WLED with high color temperature at between different temperature and reference state
    ΔTj/℃-20-15-10-50510152025303540
    ΔI/%-1.27-0.88-0.63-0.1600.240.620.911.311.601.862.402.64
    Table 3. Relative strength of spectral trough of WLED with low color temperature at different temperatures
    Measuring methodHigh color temperature LED(light up 20s)Low color temperature LED (light up 20s)High color temperature LED(light up 15s)Low color temperature LED(light up 15s)High color temperature LED(light up 60s)Low color temperature LED(light up 60s)
    Junction temperature measured by this method/℃8290.975.583.9119.8112.7
    Junction temperature measured by T3ster/℃8190.776.381.6121.5110.8
    Deviation degree1.23%0.22%-1.04%2.82%-1.39%1.71%
    Table 4. Comparisons with the results of Graphics′ T3Ster instrument
    Fu-chun JIANG, Si-yu HE, Yuan-hai LIU, Wen LIU, Guang-yue CHAI, Zhi-gang ZHAO, Bai-kui LI. A Measurement Method Based on Characteristic Spectral Parameter for Determining Junction Temperature of LED[J]. Acta Photonica Sinica, 2020, 49(3): 0330003
    Download Citation