
Xing Hu, Shangbin Yang, Kaifan Ji, Jiaben Lin, Yuanyong Deng, Xianyong Bai, Xiaoming Zhu, Yang Bai, Quan Wang. Calibration of Observing Wavelength Points of Birefringent Narrow Band Filter-Type Magnetograph Based on Neural Network[J]. Chinese Journal of Lasers, 2023, 50(13): 1304005
- Chinese Journal of Lasers
- Vol. 50, Issue 13, 1304005 (2023)
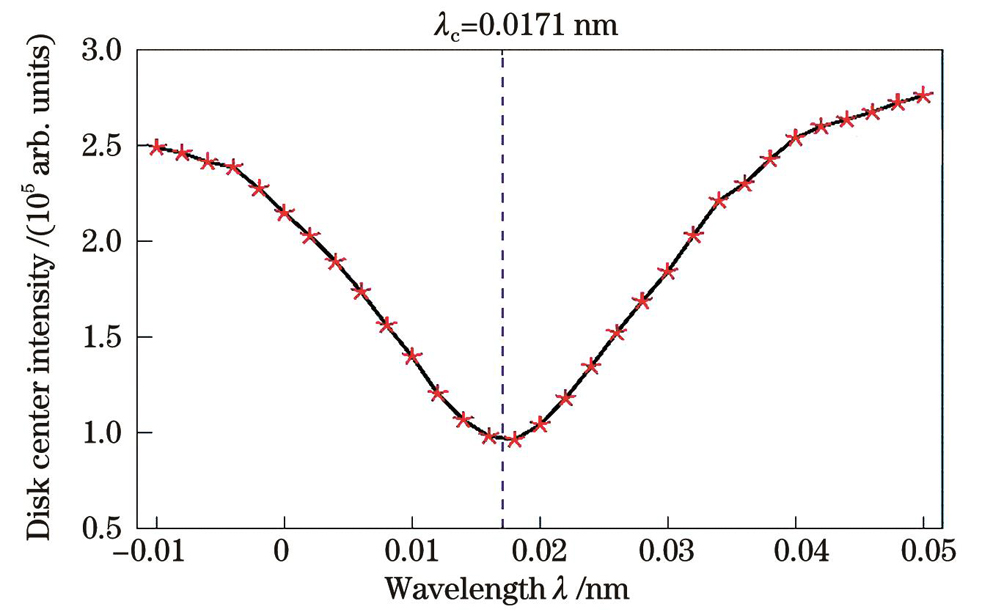
Fig. 1. Spectral line profile obtained by fitting of data
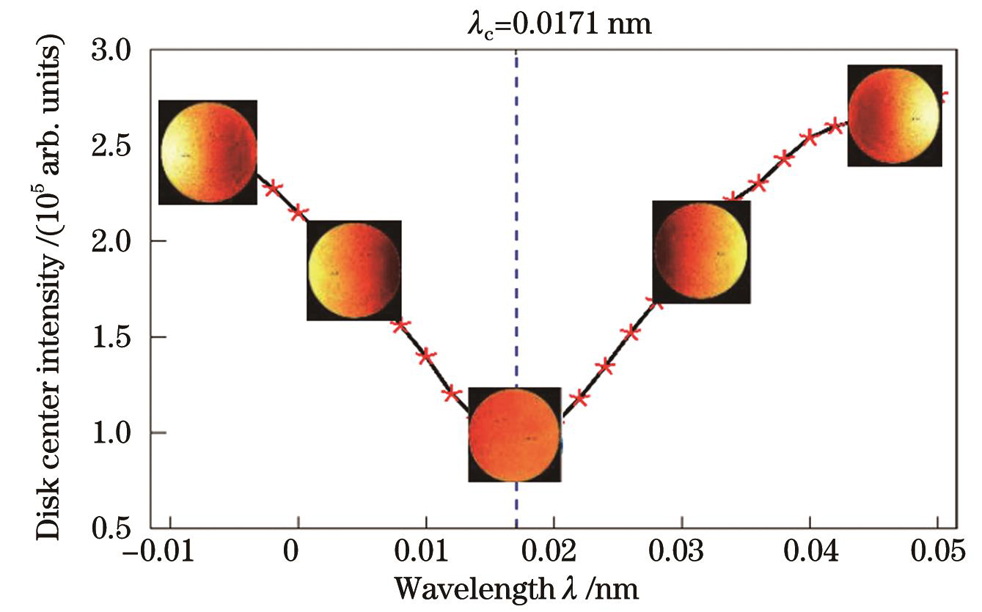
Fig. 2. Effect of Doppler velocity of solar autorotation on images at different points of spectral line
Fig. 3. Comparison before and after data processing (wavelengths in nm). (a) Original images; (b) grayscale change of original images; (c) images after edge dimming is removed; (d) grayscale change after edge dimming is removed
Fig. 4. Removing information outside solar circle. (a) Original image;(b) image after polar coordinate transformation;(c) solar part
Fig. 5. PCA decomposition contribution rate
Fig. 6. Image comparison before and after 20th-order reconstruction
Fig. 7. Image pre-processing process
Fig. 8. MLP regression network
Fig. 9. General process of calibration of observing wavelength points using BP neural network
Fig. 10. Correlation diagram of training set and test set for method validation experiment. (a) Training set; (b) test set
Fig. 11. Results of group 1 of grouping test experiment. (a) Correlation diagram of training set;(b) correlation diagram of test set;(c) residual of each data prediction result;(d) variation of residual standard deviation of each day with time
Fig. 12. Variation of residual standard deviation of different groups of grouping test experiment. (a) Group 2; (b) group 3; (c) group 4; (d) group 5
Fig. 13. Test results in range of [-0.006 nm, 0.006 nm]
|
Table 1. Experimental hardware environment
| |||||||||||||||||||||
Table 2. Time comparison between traditional calibration method and machine learning calibration method

Set citation alerts for the article
Please enter your email address
© Copyright 2018-2021 | Chinese Laser Press. All Rights Reserved 沪ICP备15018463号-20