Abstract
The dynamics of wire array Z pinches are greatly affected by the initial state of the wires, which can be preconditioned by a prepulse current. Recent advances in experimental research on preconditioned wire array Z pinches at Xi’an Jiaotong University are presented in this paper. Single-wire explosion experiments were carried out to check the state of the preconditioning and to obtain the current parameters needed for wire gasification. Double-wire explosion experiments were conducted to investigate the temporal evolution of the density distribution of the two gasified wires. Based on the results of these experiments, a double-pulse Z-pinch facility, Qin-1, in which a 10 kA prepulse current was coupled with the 0.8 MA main current was designed and constructed. Wire arrays of different wire materials, including silver and tungsten, can be preconditioned by the prepulse current to a gaseous state. Implosion of the two preconditioned aluminum wires exhibited no ablation and little trailing mass.I. INTRODUCTION
Wire array Z pinches have produced the most powerful laboratory X-ray sources to date.1–3 An X-ray power and yield of 280 TW and 1.8 MJ, respectively, were achieved on the Z machine at Sandia National Laboratories in 1998.4 The power was increased to ∼350 TW on the ZR machine.5 Owing to the remarkable X-ray power available, wire array Z pinches are of great interest for a number of applications, such as radiation physics,6 inertial confinement fusion,7 laboratory astrophysics,8 and high-energy-density plasmas.9
To further increase both X-ray power and yield, and also verify the scaling of the X-ray output to higher currents, there is great interest in the evolution of wire array Z pinches.10,11 Based on the results of experiments and simulations, the dynamics of a wire array Z pinch can be qualitatively divided into four stages: wire heating, ablation, implosion, and stagnation.12
Immediately after the current starts, Joule heating of each wire leads to the formation of a core–corona structure: a cold dense wire core surrounded by a low-density hot corona.13–15 Then, in the ablation stage, the coronal plasma carrying the current around each wire core is swept inward toward the array axis.12 This ablation process is axially inhomogeneous along the wire, presenting a quasi-periodic structure, which is considered to be one of the important seeds for the magneto-Rayleigh–Taylor (MRT) instability.4,16,17 When the wire core begins to run out of mass in certain parts of the wire, the implosion stage starts.15 The implosion front is accelerated toward the axis by the magnetomotive force, sweeping up the mass that is redistributed during the ablation phase,18 and the implosion physics is dominated by the MRT instability.15 Finally, the high-speed imploding plasma stagnates on the axis. It is compressed into a very dense state, and powerful X-ray radiation is produced.
To increase the X-ray power and yield, both symmetry and stability of the implosion are desirable to allow the plasma to reach high densities and temperatures. However, the implosion quality is severely degraded by the development of the MRT instability, which is closely related to the core–corona structure formed in the initial wire heating stage. First, the ablation of the core–corona structure is axially inhomogeneous, which results in seeding of large-amplitude perturbations at the start of the implosion.12 Second, the trailing mass left behind as a result of MRT instability of the implosion can produce alternative current paths during stagnation,19 owing to the increasing inductive voltage across the pinch. These may cause secondary implosions, resulting in secondary X-ray peaks.
Wire array experiments on medium-size generators facilitate the investigation of the evolution process of Z-pinch plasmas. A number of 1 MA level facilities, such as MAGPIE (1.4 MA, 250 ns, Imperial College London),20 ZEBRA (1 MA, 100 ns, University of Nevada, Reno),21 COBRA (1 MA, 100–200 ns, Cornell University),22 MAIZE (100 kV, 1 MA, 100 ns, University of Michigan),23 and Qiangguang-I (1.5 MA, 110 ns, Northwest Institute of Nuclear Technology, Xi’an),24 have achieved remarkable results on the implosion dynamics and radiation properties of wire array Z pinches. In addition, generators with smaller current levels, such as PPG-I (400 kA, 100 ns, Tsinghua University),25 XP (450 kA, 100–150 ns, Cornell University),26 GenASIS (200 kA, 150 ns, University of California at San Diego),27 BIN (250 kA, 100–150 ns, P. N. Lebedev Institute),28 and Qin-I (800 kA, 170 ns, Xi’an Jiaotong University),29 have also produced meaningful data on the initial behavior of wire array Z-pinch and X-pinch plasmas. Among these, the Qin-I facility is unique because it coupled a prepulse current generator inside the main current generator, making it possible to precondition the wire array.
The effects of the prepulse on wire array Z pinches have been investigated before. In these experiments, the prepulse current used had a slow rise rate (10 A/ns per wire) and a long duration.30 Consequently, the formation of the core–corona structure occurred at earlier times. This kind of prepulse current significantly impaired the parameters of X-ray emission owing to a decrease in the current flowing through the imploding plasma shell and to the greater spatial nonuniformity of the ablated plasma.
Harvey-Thompson et al. from Imperial College London proposed a specially designed load configuration: the two-stage wire array.19 In this configuration, an exploding wire array was employed as a fast current switch to produce a 1 kA, 10 ns prepulse current and then switch the main current.31 The prepulse current preheated the wire array to a gaseous state. After a ∼100 ns free expansion, the gasified wire array was imploded by the main current, which allowed the implosion of the whole mass of the load array. However, the two-stage wire array configuration for wire preconditioning imposed considerable restrictions on the range of wire array Z-pinch load configurations and on the time interval between the prepulse current and the main current.
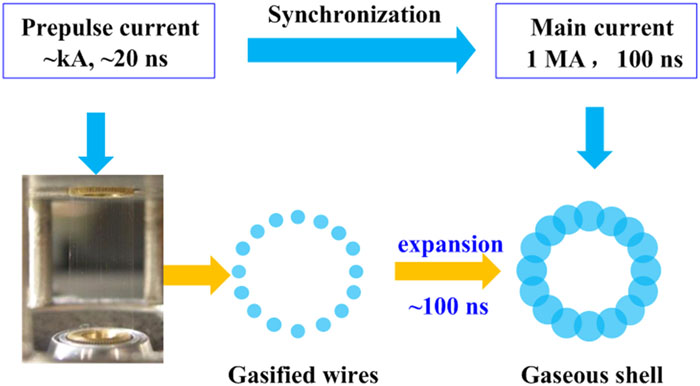
In 2012, we proposed using an auxiliary prepulse current generator, coupled with the Z-pinch machine, to precondition the wire array (Fig. 1). Since then, this idea has been tested step by step. Initially, the possibility of vaporization of one or two metallic wires driven by short current pulses was investigated. Based on the results obtained, a novel double-pulse current generator, the Qin-1 facility, which couples a ∼10 kA, 20 ns prepulse generator with a ∼0.8 MA 160 ns main current generator, was designed and constructed.29 The tailored prepulse current with a total pulse width of ∼60 ns allows appropriate preconditioning of the wire array to prevent the formation of core–corona structures; the gasified wires expand freely during the interval between the two current pulses and a gaseous shell can be formed at the start instant of the main current, as shown in Fig. 1. The experiments of two gasified aluminum wires imploding driven by the main current pulse reveals the absence of an ablation phase and the participation of the entire array mass in the implosion. With this facility, we can investigate the implosion of preconditioned wire arrays in the same geometry as in the standard wire array case, and we can figure out the effect of the initial conditions of the wire array on MRT instabilities and X-ray production.

Figure 1.Preconditioning of the wire array using an auxiliary prepulse current.
In this paper, we describe recent advances in experimental research on preconditioned wire array Z pinches in Xi’an Jiaotong University. The vaporization of a single wire of various metallic materials and the possibility of preconditioning of two wires by a 1 kA/wire current pulse are presented in Secs. II and III. In Sec. IV, the Qin-1 facility is introduced. The preconditioning of wire arrays by the prepulse generator and the implosion of the preconditioned wire arrays are introduced in Secs. V and VI. Finally, a summary of our work to date and a plan for future studies are presented in Sec. VII.
II. GASIFICATION OF A SINGLE WIRE
The first step is to figure out the parameters of the current needed for gasification of a single wire. Usually in the explosion process of a wire, a core–corona structure is formed, and shunting of the current from the wire core to the surrounding plasma terminates the Joule heating of the wire.32,33 Thus, to fully vaporize a wire, an Ohmic energy deposition greater than the atomization enthalpy in the wire core must be achieved before the voltage collapse.34
A compact current generator with a peak current of 1 kA and a rise time of 10 ns was constructed.33 A diagram of this generator is shown in Fig. 2, in which Cp is the primary capacitor, PT is the pulse transformer, Cs is the secondary capacitor, Ss is a point plane gap, and HVPS is the high-voltage power supply unit. When the pulse current generator is working, Cp (17 nF) is charged to the set voltage by the HVPS. Then the hydrogen thyratron is triggered, and the discharge circuit is connected. Cs (150 pF) is a coaxial low-inductance capacitor, which is charged by the primary discharge current through the PT (transformation ratio 1:4). The current is transferred to the load when the gap Ss undergoes self-breakdown. The load voltage and current were measured by a resistive voltage divider and a Rogowski coil, respectively.
Figure 2.Diagram of the 1 kA compact current generator.
Based on our previous experimental results, this compact current generator can vaporize an aluminum, copper, or silver wire, and the greatest part of a coated tungsten wire.35–38 The refractory metal tungsten is hard to gasify owing to its high melting point and strong electron emission property, and a dielectric coating can help to increase the energy deposition into the wire before voltage collapse.39 Schlieren and interferogram images of an exploding tungsten wire 15 µm in diameter, 1 cm in length, and with a 2 µm polyimide (PI) coating are shown in Figs. 3(a) and 3(b). From the fringe pattern in the interferogram (positively shifted), it can be inferred that most of the refractory wire is transformed into a gaseous state. This can be confirmed from the estimated energy deposition of this shot, which was 7 eV/atom, close to the atomization enthalpy of tungsten (8.6 eV/atom). Further, the areal density distribution could be reconstructed from the interferogram (neglecting the contribution of free electrons), as shown in Fig. 3(c). The linear density of the exploding products was 1.1 × 1017 cm−1, which is consistent with the initial linear density of the wire (1.12 × 1017 cm−1).
Figure 3.(a) Schlieren image of an exploding tungsten wire 15 µm in diameter, 1 cm in length, with a 2 µm PI coating. (b) Interferogram of the exploding products. (c) Areal density distribution reconstructed from the interferogram.
The exploding PI-coated tungsten wire is highly asymmetric in the radial direction, which could be caused by surface breakdown of the anode side. Previously, corona-free tungsten wire initiations were achieved by applying dielectric coatings to wires on fast-rising positive-polarity discharges or by using flashover switches to reverse the polarity of negative-polarity discharges.40,41 To reduce the asymmetry of the exploding tungsten wire under a negative discharge current, a hollow cylindrical cathode geometry was used to reverse the polarity of the radial electric field.42 In this case, full vaporization of PI-coated tungsten wires with greatly improved symmetry was achieved with an energy deposition of ∼8.8 eV/atom. Two-wavelength interferograms of an exploding coated tungsten wire in the hollow cylindrical cathode geometry are shown in Figs. 4(a) and 4(b), and the reconstructed atomic and electronic density distributions are shown in Figs. 4(c) and 4(d). Further, this hollow cathode configuration can also be optimized for use in multi-MA facilities.
Figure 4.(a) 532 nm and (b) 1064 nm double-wavelength interferograms for a hollow cylindrical load. (c) Atomic areal density. (d) Electronic areal density.42 Reprinted with permission from Li et al., Phys. Plasmas 25, 012705 (2018). Copyright 2018 AIP Publishing LLC.
III. EXPANSION AND MERGER OF GASIFIED WIRES
After the prepulse current, the gasified wires expand freely in vacuum before the main current is applied. Since the mass density distribution has a vital effect on the implosion dynamics, it is interesting to know how the density distribution of a gasified wire array varies with time. We investigated the expansion and merger of two gasified wires. The experiments were based on the 1 kA/10 ns pulsed current generator shown in Fig. 2, and the load wires (aluminum and tungsten, 15 µm in diameter, 1 cm in length) were positioned at separations of 1–3 mm.35 The expansion and merger of the exploding products were investigated using a two-wavelength (532 nm and 1064 nm) interferometer.43,44
Experimental images of the exploding double Al wires are shown in Fig. 5. It can be seen that the wires were transformed into two expanding aluminum gas columns by the pulsed current, as shown in Figs. 5(a) and 5(b). The shift directions of the fringes in the 532 nm image suggested that the exploding products were dominated by neutral atoms. The expanding columns collided with each other later in time, creating a high-density region in the middle, as shown in Figs. 5(c) and 5(d).
Figure 5.(a)–(d) Interferometric images at different times from different shots. All the loads tested were two 15 µm Al wires, 1 cm in length and with 1 mm spacing. White arrows indicate the initial positions of the wires.35 Reprinted with permission from Wu et al., Phys. Plasmas 23, 112703 (2016). Copyright 2016 AIP Publishing LLC.
The dynamics of the collision and merger process can be seen in the density profiles reconstructed from laser interferometry, as shown in Fig. 6. At an instant 51 ns before the wires merged, the mass was distributed symmetrically around the initial positions of the wires. The total number of atoms can be determined by integrating the areal densities along the radial direction. The two wires at t = 51 ns had linear densities of 9.9 × 1017 cm−1 and 9.2 × 1017 cm−1 respectively, corresponding to 93% and 87% of the initial mass (10.6 × 1017 cm−1) of a 15 µm Al wire. After the instant of 135 ns, the density gradient of the middle region between the wires was too great for interferometric measurements (the red line in Fig. 6). This mass accumulation is brought by the collision of the expanding gases from the two wires. The density of the remaining part was 80% of the initial wire mass at 135 ns. Later in time at 336 ns (pink line), the full mass distribution could be measured owing to the falling density. It can be seen that a significant fraction of mass was in the stagnation region at 336 ns. The total linear density determined by integrating its distribution was 1.6 × 1018 cm−1, or 75% of the initial load mass (two wires). Moreover, the reconstructed electron densities at the three instants were negligible, as can be seen from Fig. 6, indicating that the wires were fully vaporized.
Figure 6.Areal density distributions at different times, from two 15 µm Al wires 1 cm in length and with 1 mm spacing. The inset is a schematic of the experiments.35 Reprinted with permission from Wu et al., Phys. Plasmas 23, 112703 (2016). Copyright 2016 AIP Publishing LLC.
When the load is mounted parallel to the probing laser, a side-view interferometric image of the load can be obtained, and the corresponding reconstructed areal densities are shown in Fig. 7 (237 ns). The unfolding of the interferograms yielded the areal density shown in Fig. 7(c). The linear density, equal to 1.6 × 1018 cm−1, accounts for 75% of the total load mass. It can be seen that the total detected mass decreased with time as the vapor expanded in both Figs. 6 and 7. Three causes could be responsible for the missing mass. First, the undetectable region in the middle accounts for a part of the total mass. Second, the low-density gas expanded to a greater distances cannot be detected owing to the insensitivity of the laser. Third, it is possible that some fraction of the gaseous atoms might coalesce to form liquid droplets or clusters during the expansion of the wire.
Figure 7.(a) Interferometric images from Shot 16054 (two 15 µm Al wires, 1 cm in length and with 1 mm spacing) at 237 ns, probed in the direction parallel to the wires. (b) Areal density distribution from Shot 16054. (c) Schematic of the stagnation region in the middle of the wires.35 Reprinted with permission from Wu et al., Phys. Plasmas 23, 112703 (2016). Copyright 2016 AIP Publishing LLC.
IV. THE QIN-1 FACILITY
Following the idea of using an auxiliary current generator to precondition the wire array, we set up a double-pulse generator named the Qin-1 facility. It is composed of two independent generators: a prepulse generator and a main current generator.
The prepulse current generator was designed based on the double-wire experiments described above, and the restrictions from coupling the two generators were also considered. The prepulse generator was composed of a 5.8 nF capacitor and an SF6 gas switch. Its output current to a 5 Ω matched load had a peak value of 10 kA, a rise time of 20 ns, and a pulse width of 65 ns. The parameters of the prepulse current were known to be sufficient to gasify a wire array composed of up to ten wires about 10 µm in diameter.
The design of the main current generator was similar to that adopted in the linear transformer driver approach. It was composed of 42 bricks, uniformly distributed in a hexagonal layout inside a cavity and immersed in transformer oil. Each brick was composed of two 90 nF capacitors and one 200 kV air-gas switch. The outputs of the bricks were connected directly to a high-voltage negative plate with no ferromagnetic cores being used. The short current of the main current generator reached 800 kA with a 160 ns rise time under a charging voltage of ±50 kV.
The prepulse current generator was placed directly underneath the load section, surrounded by the 42 bricks as shown in Fig. 8(a). The high-voltage outputs of the prepulse generator were connected to the high-voltage plate of the main current generator. To produce a fast-rising and short-pulse-width prepulse current, we needed to reduce the current inductance of the prepulse generator. Post-hole structures with the ground posts of the prepulse generator passing through the high-voltage plate of the main current generator were used, as shown in Fig. 8(a).
Figure 8.(a) Qin-1 facility. (b) Short load currents of both the prepulse current and the main current with different time intervals. The charging voltage of the main current generator was ±30 kV.
The prepulse current generator and the main current generator were triggered individually, so the time delay between the two pulses was adjustable. Typical short currents with both the prepulse current and the main current are shown in Fig. 8(b), with a charging voltage of ±30 kV for the main current generator.
In the Qin-1 facility, a Rogowski coil was used to measure both the main current and the prepulse current, but unfortunately the load voltage was not measured during the experiments. The X-ray radiation from the wire array was measured using Si-pin detectors (AXUV-HS5) with different X-ray filters. The dynamics of the wire array were obtained using laser probing. During most of the experiments, two probing lasers were used: a 532 nm, 30 ps laser and a 532 nm, 10 ns laser.
V. PRECONDITIONING OF WIRE ARRAYS BY A PREPULSE CURRENT
The wire array was preconditioned by the prepulse current before implosion.29 The aim of this preconditioning was to preheat the array to a gaseous state instead of to core–corona structures. The capabilities of the prepulse current generator were investigated. Wire arrays of different configurations and different materials were tested.
The current, self-emission, and probing laser waveforms of a cylindrical silver wire array with a diameter of 11 mm and a length of 2 cm are shown in Fig. 9. The array was made of ten 25 µm silver wires. The prepulse current had a peak value of 14 kA and a rise time of ∼20 ns. A laser interferometric image obtained 436 ns after the start of the prepulse current is shown in Fig. 9(b). Interferometric fringes superimposed by quasi-periodic stratifications caused by electrical–thermal instability are clearly observable throughout the wires, indicating that the exploding wires had no dense core and that they were mostly vaporized with an energy deposition greater than the atomization enthalpy.
Figure 9.(a) Current (black curve), self-emission (red curve), and probing laser (blue curve) waveforms of a 10 × 25 µm silver wire array with a diameter of 11 mm and a length of 2 cm. (b) Laser interferometric images obtained 436 ns after the current started.29 Reprinted with permission from Wu et al., Plasma Phys. Controlled Fusion 60, 075014 (2018). Copyright 2018 IOP Publishing.
The gasification of a tungsten wire array is shown in Fig. 10. Tungsten wires of diameter 15 µm with PI coatings of thickness 2 µm were used here. The PI coating was able to suppress the rapid expansion of the low-density desorbed gas and metallic vapors and thus delay breakdown and increase the energy deposition. Since tungsten has a greater resistivity, a higher melting temperature, and a stronger electron-emitting property than silver, gasification of the tungsten wires was much more difficult to achieve. Two more methods were also used here: a flashover switch was installed to increase the current rise rate, and a hollow cylindrical cathode was used to reverse the polarity of the radial electric field on the wires from negative to positive,42 which greatly suppressed electron emission from the wire surface.
Figure 10.(a) Schematic of the load configuration with a flashover switch and a hollow cylindrical cathode. (b) Laser interferometric images of a cylindrical tungsten wire array 287 ns after the current started. The array consisted of five wires, 15 µm in diameter, with a polyimide coating of 2.5 µm thickness.29 Reprinted with permission from Wu et al., Plasma Phys. Controlled Fusion 60, 075014 (2018). Copyright 2014 IOP Publishing.
Most parts of the wires were vaporized, except for a region of length about 1 mm close to the anode. One of the reasons for this nonuniformity in the anode region was probably the poor electrical contact, since the insulating coating was not removed. The fringes in the laser interferometric images were then traced and the density profiles were calculated, with the results shown in Fig. 11. At 287 ns, the peak areal density of a gasified tungsten wire was about 8.5 × 1017 cm−2. The linear density of the atoms was calculated by integrating the areal density along the x direction, and a value of ∼9 × 1016 cm−1 for a single wire was found, corresponding to ∼80% of the initial mass (1.1 × 1017 cm−1).
Figure 11.(a) Areal density distribution calculated from the laser interferometric images shown in Fig. 4 for a 5 × 15 µm cylindrical tungsten wire array with a 2.5 µm thickness PI coating at 287 ns. (b) Density profile for a single wire obtained by Abel inversion.29 Reprinted with permission from Wu et al., Plasma Phys. Controlled Fusion 60, 075014 (2018). Copyright 2014 IOP Publishing.
VI. IMPLOSION OF PRECONDITIONED WIRE ARRAY
Implosions of the preconditioned wire array were investigated on the Qin-1 facility with the main current applied. Here we report the results for two aluminum wires, and experiments with eight or more wires are in progress. It is worth noting that some of the properties (e.g., the level of precursor current) of the two-wire array will be different from those of a cylindrical wire array owing to their different magnetic topologies.
With driving only by the main current, typical laser shadowgraphs of two aluminum wires (15 µm in diameter and 1 cm in length) are shown in Fig. 12. The characteristics of ablation are clearly seen. Mass from the core–corona structures has been swept into the region between the two wires. The ablation flow is inhomogeneous along the wire, with an axial modulation wavelength of ∼0.4 mm. This inhomogeneous ablation is considered to be one of the main seeds for the MRT instability. In addition, a precursor plasma column with m = 1 MHD instability can clearly be observed. The probable reason is that the two wires have an open magnetic topology, and more current will switch into the ablated plasma and produce a precursor plasma column.
Figure 12.Laser shadowgraphs of two 15 µm aluminum wires driven by the main current alone. (a) Shot 2017042805, with 3 mm wire spacing, probed 183 ns after the main current started. (b) Shot 2017051304, with 5 mm wire spacing, probed 160 ns after the main current started.29 Reprinted with permission from Wu et al., Plasma Phys. Controlled Fusion 60, 075014 (2018). Copyright 2014 IOP Publishing.
With the application of a prepulse current, laser shadowgraphs of two aluminum wires (3 mm spacing, Shot 2017050901) after the main current started are shown in Fig. 13. The prepulse current had a peak value of 25 kA and a rise time of ∼20 ns. The time interval between the prepulse current and the main current was 310 ns, and the peak value of the main current was about 250 kA under a charging voltage of ±30 kV. The implosion dynamics of the preheated wires were completely different from the ablation process shown in Fig. 12.
Figure 13.Laser shadowgraphs of two 15 µm aluminum wires with 3 mm spacing when a prepulse current was applied. The white lines indicate the initial positions of the wires. The probing times and shot numbers are given below the images.29 Reprinted with permission from Wu et al., Plasma Phys. Controlled Fusion 60, 075014 (2018). Copyright 2014 IOP Publishing.
At 101 ns after the main current started, the shadowgram image shows the exploding products of the two wires, together with a snowplow implosion piston located outside. It seems that the magnetic piston at this time only accreted the previously expanded low-density vapors to the axis, and had not reached the position of the main body of the exploding wires. These low-density vapors were formed owing to the vaporized and desorbing gas from the wires driven by the prepulse current. The piston moved to the position at which the main products of the exploding wires were located 147 ns after the current started [Fig. 13(c)]. Small perturbations could be observed at the edges of the current path. Then the piston moved forward to the axis, and there was a significant growth of MRT instability with bubbles and spikes. At a time around 192 ns, the plasma stagnated on the axis, and no mass could be observed in the region outside the two wires from the laser shadowgraphs. Based on the position of the piston, the imploding velocity was about 26 km/s.
VII. CONCLUSION AND DISCUSSION
In this paper, we have presented an overview of the experimental research on preconditioned wire array Z pinches at Xi’an Jiaotong University. The idea of using an auxiliary prepulse current generator coupled with the Z-pinch machine to precondition the wire array was proposed in 2012, and since then the idea has been tested step by step. First, one- and two-wire explosion experiments were carried out to check the state of the preconditioning. Gasification of a tungsten wire was achieved, and the temporal evolution of the density distribution from two gasified wires was obtained. Second, a double-pulse generator, the Qin-1 facility, coupling a 10 kA prepulse current with a 0.8 MA main current, was designed and constructed. Wire arrays of different wire materials, including silver and tungsten, can be preconditioned by the prepulse current to a gaseous state. Finally, experimental results showed that the implosion of the preconditioned two aluminum wires exhibits no ablation and little trailing mass.
An analytical model of an expanding gasified wire gives results closely matching experiment results for an exploding single wire35 and can be used to predict the density distribution of a preconditioned wire array at the instant when the main pulse starts. However, even though the initial mass distribution of a single wire can be estimated, there are still many difficulties in theoretically describing the imploding dynamics of a preconditioned wire array. First, the undetectable low-density coronal plasma formed during Joule heating makes it hard to determine the location of the current path. Consequently, the state of the neutral gas is unclear after the start of the main current, owing to the presence of unknown current channels. Second, the actual density distribution of the preconditioned wires can be affected by collision of adjacent wires, which produces a complicated initial distribution of the load. Third, it is observed from the probing images that the implosion of the preconditioned wires develops significant MRT instabilities during the implosion, and the perturbation seeds of these instabilities are unknown.
More experiments are needed to investigate the implosion dynamics and radiation characteristics of preconditioned wire arrays. At present, experiments with cylindrical and planar wire arrays using 8–12 aluminum wires are being carried out. The preliminary results indicate that both ablation and the trailing mass are completely suppressed with the help of the prepulse current on the Qin-1 facility. A greater amount of mass participates in the implosion, and an increase in X-ray yields is measured. However, the implosion still suffers from the MRT instability, and multiple bursts are observed. In further work, we will focus on the development of MRT instability in implosions of preconditioned wire arrays. In addition, there is a need to develop a more satisfactory implosion model for preconditioned wire array Z pinches.
References
[1] M. G. Haines. Plasma Phys. Controlled Fusion, 53, 093001(2011).
[2] W. Meng, S. Song, H. Li, S. Feng, Q. Tian, W. Xie, J. Deng, M. Xia, C. Ji, H. An. Matter Radiat. Extremes, 1, 48(2016).
[3] C. Xue, Y. Zhang, S. Sun, Z. Gao, L. Yin, Z. Dai, D. Xiao, C. Ning, J. Wu, N. Ding. Matter Radiat. Extremes, 1, 135(2016).
[4] R. W. Lemke, D. B. Sinars, W. A. Stygar, E. M. Waisman, H. L. Hanshaw, E. P. Yu, T. A. Brunner, T. A. Haill, M. E. Cuneo, C. A. Jennings. Phys. Rev. Lett., 102, 025005(2009).
[5] M. G. Mazarakis, J. M. Elizondo, D. E. Bliss, D. H. Mcdaniel. The ZR refurbishment project, 23(2002).
[6] D. A. Hammer, P. F. Knapp, A. D. Cahill, J. B. Greenly, S. A. Pikuz, P. A. Gourdain, T. A. Shelkovenko, C. L. Hoyt, B. R. Kusse. Appl. Phys. Lett., 100, 244106(2012).
[7] E. M. Waisman, I. C. Smith, D. B. Sinars, G. R. Bennett, W. A. Stygar, S. V. Lebedev, P. K. Rambo, J. L. Porter, R. A. Vesey, M. E. Cuneo. Plasma Phys. Controlled Fusion, 48, R1(2005).
[8] T. C. Underwood, M. A. Cappelli, K. T. K. Loebner, T. Mouratidis. Appl. Phys. Lett., 108, 094104(2016).
[9] Y. E. Krasik, S. Efimov, A. Rososhek, M. Nitishinskiy, D. Yanuka. Appl. Phys. Lett., 109, 244101(2016).
[10] J. F. Seamen, J. S. Mcgurn, G. O. Allshouse, T. J. Nash, B. M. Marder, T. L. Gilliland, R. B. Spielman, T. W. Sanford, R. C. Mock, D. Jobe. Phys. Rev. Lett., 77, 5063(1996).
[11] D. E. Bliss, E. M. Waisman, E. P. Yu, S. V. Lebedev, M. E. Cuneo, R. A. Vesey, G. A. Chandler, W. A. Stygar, T. J. Nash, J. P. Chittenden et al. Phys. Rev. E, 71, 46406(2005).
[12] A. E. Dangor, J. P. Chittenden, M. G. Haines, S. V. Lebedev, S. A. Pikuz, F. N. Beg, S. N. Bland, T. A. Shelkovenko, K. H. Kwek. Phys. Plasmas, 8, 3734(2001).
[13] D. B. Sinars, D. A. Hammer. Laser Part. Beams, 19, 377(2001).
[14] T. A. Khattatov, A. R. Mingaleev, S. A. Pikuz, O. G. Ol’Khovskaya, V. M. Romanova, T. A. Shelkovenko, Y. G. Kalinin, S. I. Tkachenko, V. A. Gasilov. Plasma Phys. Rep., 38, 1(2012).
[15] S. N. Bland, M. G. Haines, I. H. Mitchell, J. P. Chittenden, A. E. Dangor, S. V. Lebedev, R. Aliaga-Rossel. Phys. Plasmas, 6, 2016(1999).
[16] C. A. Jennings, J. P. Chittenden. Phys. Rev. Lett, 101, 055005(2008).
[17] J. P. Chittenden, S. V. Lebedev, T. A. Shelkovenko, A. E. Dangor, S. A. Pikuz, S. N. Bland, M. G. Haines, F. N. Beg. Phys. Rev. Lett., 85, 98(2000).
[18] A. Rosenbluth, R. G. M. Rosenbluth(1954).
[19] G. P. De, S. N. Bland, E. Khoory, S. V. Lebedev, G. Burdiak, E. M. Waisman, G. N. Hall, A. J. Harvey-Thompson, F. Suzuki-Vidal, J. P. Chittenden. Phys. Rev. Lett., 106, 205002(2011).
[20] J. P. Chittenden, S. V. Lebedev, F. N. Beg, S. N. Bland, M. G. Haines, A. E. Dangor. Phys. Plasmas, 9, 2293(2002).
[21] V. L. Kantsyrev, G. C. Osborne, V. V. Shlyaptseva, M. E. Weller, K. M. Williamson, N. D. Ouart, P. Cox, A. A. Esaulov, I. Shrestha, A. S. Safronova. Phys. Plasmas, 17, 112705(2010).
[22] D. A. Hammer, J. B. Greenly, B. R. Kusse, S. C. Glidden, H. D. Sanders, J. D. Douglas. Rev. Sci. Instrum., 79, 073501(2008).
[23] A. M. Steiner, P. Zhang, N. M. Jordan, Y. Y. Lau, D. A. Yagerelorriaga, P. C. Campbell, R. M. Gilgenbach. Phys. Plasmas, 23, 124502(2016).
[24] L. Sheng, L. P. Wang, B. D. Peng, M. Li, Y. Li, M. Zhang, X. J. Zhang, C. Zhao, J. H. Zhang, Y. Yuan. Phys. Plasmas, 22, 122710(2015).
[25] Y. Zhao, X. Wang, R. Zhang, Y. Du, T. Zhao, X. Zou, R. Liu. IEEE Trans. Plasma Sci., 38, 646(2010).
[26] F. N. Beg, S. A. Pikuz, J. P. Chittenden, M. Zakaullah, S. V. Lebedev, T. A. Shelkovenko, M. G. Haines, D. A. Hammer, S. N. Bland, A. E. Dangor. Rev. Sci. Instrum., 72, 671(2001).
[27] F. Beg, D. Mariscal, J. Chittenden, J. Valenzuela, G. Collins. IEEE Trans. Plasma Sci., 43, 2527(2015).
[28] S. A. Pikuz, A. Y. Faenov, I. Y. Skobelev, R. E. H. Clark, V. M. Ramanova, T. A. Shelkovenko, D. A. Hammer, J. Abdallah, G. Csanak. J. Exp. Theor. Phys., 85, 484(1997).
[29] S. V. Lebedev, Y. Lu, J. Wu, X. Jiang, D. Zhang, X. Li, F. Sun, Z. Wang, A. Qiu. Plasma Phys. Controlled Fusion, 60, 075014(2018).
[30] V. D. Selemir, R. V. Savchenko, M. S. Ibragimov, A. P. Orlov, P. B. Repin, V. T. Selyavskiĭ, B. G. Repin. Plasma Phys. Rep., 35, 42(2009).
[31] S. Lebedev, L. Suttle, S. Bland, G. Hall, P. De Grouchy, L. Pickworth, A. Harveythompson, G. Swadling, F. Suzukividal, G. Burdiak. Characterisation of the current switch mechanism in two-stage wire array Z-pinches. Phys. Plasmas, 22, 112710(2015).
[32] D. H. McDaniel, G. S. Sarkisov, S. E. Rosenthal, K. R. Cochrane, K. W. Struve, C. Deeney. Phys. Rev. E, 71, 46404(2005).
[33] A. C. Qiu, Z. F. Yang, J. Wu, Z. Q. Shi, Y. Li, S. L. Jia, X. W. Li. Acta Phys. Sin., 63, 125206(2014).
[34] G. S. Sarkisov, D. H. Mcdaniel, K. W. Struve. Phys. Plasmas, 12, 052702(2005).
[35] S. V. Lebedev, X. Li, Z. Yang, S. Jia, J. Wu, Y. Lu, A. Qiu. Phys. Plasmas, 23, 112703(2016).
[36] Y. Lu, J. Wu, A. Qiu, D. Zhang, X. Li. Phys. Plasmas, 24, 112701(2017).
[37] Z. Wu, S. Jia, Z. Shi, Y. Shi, K. Wang. Phys. Plasmas, 24, 012706(2017).
[38] Y. Li, Z. Q. Wu, S. L. Jia, A. C. Qiu, K. Wang, Z. Q. Shi, Y. J. Shi, J. Bai. Acta Phys. Sin., 65, 15203(2016).
[39] A. Qiu, J. Wu, X. Li, Y. Li, M. Li. J. Phys. D: Appl. Phys., 50, 403002(2017).
[40] K. W. Struve, G. S. Sarkisov, S. E. Rosenthal, D. H. McDaniel. Phys. Rev. Lett., 94, 035004(2005).
[41] X. Zou, H. Shi, X. Wang. Appl. Phys. Lett., 109, 134105(2016).
[42] M. Qiu, J. Wu, Y. Li, Y. Lu, M. Li, X. Li. Phys. Plasmas, 25, 012705(2018).
[43] A. Houard, L. Arantchouk, G. Point, J. Carbonnel, B. Prade, Y. Brelet, A. Mysyrowicz. Rev. Sci. Instrum., 85, 123101(2014).
[44] A. Qiu, S. Jia, J. Han, W. Wei, X. Li, J. Wu, Z. Yang. Phys. Plasmas, 23, 083523(2016).