
Sergey Sergeyev, Stanislav Kolpakov, Yury Loika. Vector harmonic mode-locking by acoustic resonance[J]. Photonics Research, 2021, 9(8): 1432
- Photonics Research
- Vol. 9, Issue 8, 1432 (2021)
Abstract
1. INTRODUCTION
Ultrafast lasers with a high repetition rate constitute a versatile technology towards producing ultra-stable femtosecond pulse trains (optical frequency combs having fractional uncertainties of and lower [1–9]) with characteristics required in metrology, high-resolution spectroscopy, microwave photonics, remote sensing, astronomy, and telecommunications [6–9]. Typically, the repetition rate of such lasers is limited by hundreds of megahertz (MHz), which is imposed by the difficulty of shortening the laser cavity [1–9].
The selective excitation of the harmonics of the fundamental frequency—harmonic mode-locking (HML)—is a practical pathway to increase the repetition rate hundreds of times through the use of resonance with the acoustic phonons, four-wave mixing, pattern-forming modulation instability, or/and through the insertion of a linear component featuring a periodic spectral transfer function [4,5,10–16].
The most attractive technique of a stable HML is based on the resonance of a harmonic of the fundamental repetition rate with the frequency of a transverse acoustic wave and leads to tunable mode-locking with repetition rates up to a few gigahertz (GHz) while narrowing the RF line width down to 100 Hz [4,5,10,11]. The HML originates from the multi-pulsing caused by the laser’s gain bandwidth constraint. The gain bandwidth limits the growth of the pulse spectral bandwidth with increased pump power. As a result, many pulses emerge, and the energy is shared between pulses and pulses’ bandwidths that satisfy the gain bandwidth constrain [5,17]. The pulses propagating in the cavity excite the radial, , and torsional-radial, , acoustic modes through perturbations of the fiber core refractive index and the fiber birefringence [Figs. 1(a) and 1(b), [18–20]]. By adjustment of the in-cavity linear and circular birefringence with the help of the in-cavity polarization controller (POC), an opportunity was demonstrated to control the interaction between the neighbored pulses and acoustic modes from attractive to repulsive forces and so the dynamics, from the vector soliton rain to HML, are driven by acoustic modes [11,21].
Sign up for Photonics Research TOC. Get the latest issue of Photonics Research delivered right to you!Sign up now
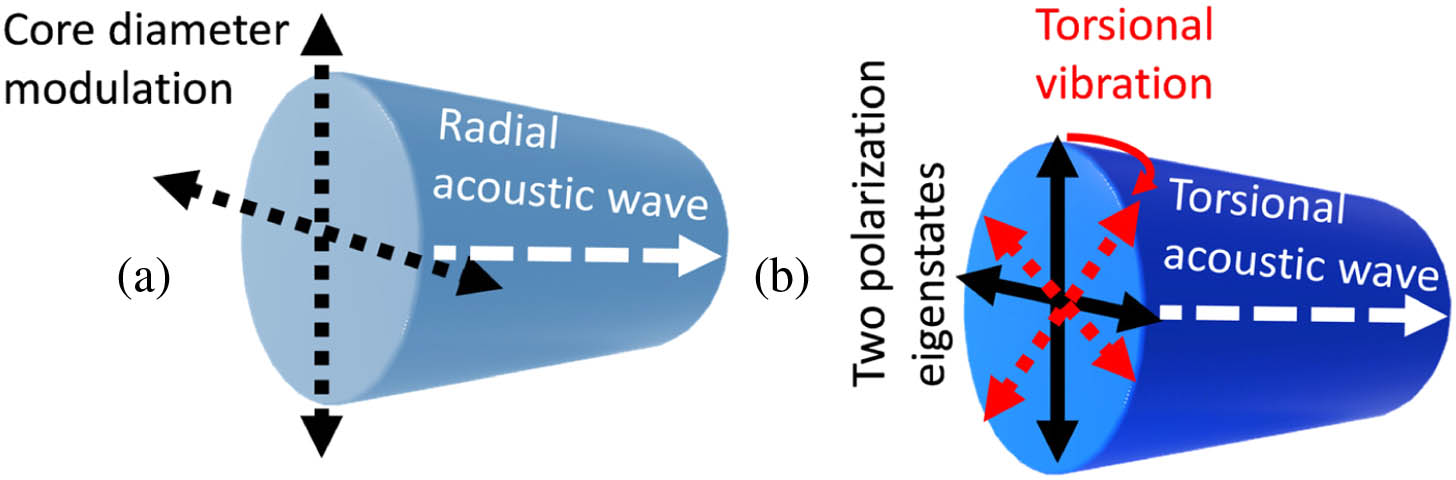
Figure 1.Acoustic modes in an optical fiber core: (a) radial mode,
Recently, for the ring fiber resonator without a saturable absorber, mode-locking was demonstrated based on the mechanism of vector resonance multimode instability (VRMI) [22]. Increased birefringence strength causes spatial modulation of the cavity parameters (with a period related to the birefringence beat length) and leads through the Faraday instability to a parametric resonance at the fundamental frequency that acts as active mode-locking [22]. For the case of HML, the modes mainly perturb the fiber birefringence only, and so acoustically induced oscillations of the fiber birefringence are relatively weak [18,19]. Therefore, there is a challenging task of revealing the interplay between VRMI and acoustic modes-based perturbation towards the stabilization of HML.
In this paper, for the first time, to the best of our knowledge, we demonstrate theoretically and experimentally a new mechanism of HML that does not require the presence of a saturable absorber or Kerr-effect-based nonlinear polarization rotation. Based on the vector model of the mode-locked fiber laser (MLFL) developed by Sergeyev et al. [22,23] and results on fundamental frequency mode-locking based on VRMI [22], we reveal a novel vector HML mechanism that is based on an interplay of VRMI with birefringence distortions caused by . For the actual setup, the resonance occurred for the 24th, 38th, and 45th harmonics and resulted in linewidth narrowing below the values previously reported by Grudinin and Gray [10].
2. EXPERIMENTAL SETUP AND METHODS
The experimental setup is shown in Fig. 2(a). The cavity includes 15.8 m of standard telecommunication fiber (SMF28) and 75 cm of Liekki Er80-8/125 gain fiber (Er-doped fiber, EDF) with the anomalous dispersion of and modal field diameter of 9.5 μm. The length of the whole cavity, taking into account the physical length of all components, was 17 m. The pump laser diode (LD, 14xx nm series with an isolator) has the maximum optical power up to 250 mW, which was measured after POC1, the optical isolator [not shown in Fig. 2(a)], and wavelength division multiplexer (WDM). POC1 and an optical isolator for 1560 nm were placed between the diode output and the WDM. The isolator was used to improve the laser diode stability. The 80:20 output coupler was used to direct the light out of the cavity. In the first experiment, the laser was assembled with an optical isolator with 25 dB attenuation. In this configuration, it was impossible to obtain periodic pulsations, and the output exhibited noisy behavior. After installation of an isolator with 51 dB attenuation, the laser was successfully mode-locked. The backpropagated radiation was controlled through the auxiliary port [not shown in Fig. 2(a)], and the level of the backscattered power was measured to be in comparison with the power measured from the port labeled with “OUTPUT C”. The threshold was found to be close to 36 mW of the pump power using linear extrapolation of the signal versus the pump power curve to zero value of the signal power, as illustrated in Fig. 2(b). To characterize the polarization laser dynamics at the time scales of 1 μs–20 ms (averaging over 10 roundtrips), we used a polarimeter (IPM5300, Thorlabs) to record the normalized Stokes parameters, , , , the total output power, , and degree of polarization (DOP). Those are related to the output powers of two linearly cross-polarized states of polarization (SOPs), and , and to the phase difference between them, [11,22–24]:
![]()
Figure 2.Operation of the laser at the fundamental frequency. (a) Er-doped fiber laser. EDF, Er-doped fiber; LD, 1480 nm laser diode for the pump; POC1 and POC2, polarization controllers; OISO, optical isolator; WDM, wavelength division multiplexer; OUTPUT C, 80:20 output coupler. (b) Average laser output power versus pump power; inset: the RF linewidth versus pump power (370 Hz at 220 mW pump power). The rectangle indicates the interval where unstable mode-locking patterns have been observed. (c) The optical spectrum; inset: the same spectrum plotted using a linear scale: 0.2 nm is a bandwidth at the 3 dB level. (d) The train of pulses at the fundamental frequency; inset: time-resolved pulse.
As seen there, the absence of a polarizer and the presence of only one POC inside the laser cavity, together with low pump powers (less than 200 mW), rule out the possibility of mode-locking through nonlinear polarization rotation.
3. VECTOR MODEL OF THE Er-DOPED FIBER LASER
To understand the mechanism of vector mode-locking caused by stable self-mode locking and the tunability of HML and linewidth narrowing, we developed a new vector model of EDF lasers (EDFLs) as described in Appendix A. The model accounts for the linear and circular birefringence and fast- and slow-axis modulation caused by acoustic modes. Without accounting for the gain dynamics, the SOP evolution in terms of the Stokes vector and number of roundtrips caused by the interplay of the factors mentioned above can be described as follows:
Previously, it was illustrated [22] that the linear birefringence tuning results in the VRMI in a fiber laser. By adjusting the in-cavity and pump wave POCs, we were able to increase the birefringence strength, leading to the generation of two satellite lines around the -harmonic frequency. When the beat length equals the cavity length, the frequencies of the satellites for the -harmonic were in resonance with the and harmonics that result in longitudinal modes synchronization.
The complexity of the vector model (see Appendix A) exceeds the complexity of any known scalar or vector models of fiber lasers considered elsewhere. As follows from Ref. [22], the linear stability analysis, even for the simplified system without accounting for the circular birefringence and acoustic modes, results in the number of eigenfrequencies with the ratio (with respect to the fundamental frequency ) of . It leads to the necessity of accounting for many time scales, and so vast computation resources will be required. Given the complexity of the problem, we introduced a few approximations to reveal the effect of on the modulation of the output power at frequency , resulting in HML if the frequency coincides with the frequency of the harmonic . First, though modulates all modes that result in HML stabilization shown in Fig. 3, in the theoretical analysis, we accounted for only the interplay of the linear and circular birefringence with the acoustic-mode-based modulation for harmonic in terms of the ability of exciting of the output power oscillations at a frequency of the mode. Next, we combined Eqs. (2) and (3) with our vector model of the EDFL [22,23].
![]()
Figure 3.(a) Acousto-optical polarization-dependent locking of a high harmonics RF comb showing the 24th harmonic along with satellites of 23rd-,24th-, and 25th-harmonics tuning with the help of in-cavity POC2. (b) Emergence of the 293.16 MHz pulse train for positions 15, 16, 17, and 18 of POC2. (c) Evolution of the RF spectrum of the 293.16 MHz line for positions 15, 16, 17, and 18 of POC2. (d) The output SOPs for POC2 positions 15 and 18 (measurement resolution is 1 μs).
4. RESULTS
A. Experimental Results
The output power versus pump power, the emission spectrum, and the pulse train are shown in Figs. 2(b)–2(d). When the pump power exceeded 48 mW, stable mode-locked pulses could be observed on the oscilloscope. As seen in Fig. 2(d), the observed pulse train has the fundamental repetition rate of 12.21 MHz. The mean value of the RF linewidth at the fundamental frequency at the 3 dB level was only 370 Hz [see the inset of Fig. 2(b) and Table 1 in Appendix B]. This value is much less than the typical values of 10 kHz found for mode-locked lasers with a saturable absorber [1–9]. The transient time for stabilization of this regime varies from a fraction of a second to a few minutes. The pulse trace with 20 ps pulse width is shown in the inset of Fig. 2(d). (Details of pulse width measurements are found in Appendix A.) The signal-to-noise ratio (SNR) of four (6 dB), as shown in Fig. 2(d), indicates partial mode-locking. The most stable patterns observed in our experiments were at the fundamental frequency of 12.21 MHz and its high-order harmonics at frequencies of 293.16 MHz, 464.17 MHz, and 549.7 MHz (Table 1 in Appendix A). Previously, it was shown that excitation of oscillations at such frequencies could be caused by the resonance structure of the spectrum of acoustic phonons excited by this comb through the electrostriction effect [4,5,10,11].
The dynamics of the HML at 293.16 MHz is illustrated in Figs. 3(a)–3(d). A segment of the RF spectra in the mode-locked regime is shown in Fig. 3(a). The lines “A,” “B,” and “C” correspond to the 23rd, 24th, and 25th harmonics of the fundamental frequency. To understand the origin of the satellite lines, we changed the birefringence in the laser cavity by turning the knob of POC2 and kept the pump power fixed at 160 mW. While the angle of the knob was tuned among 18 positions, the satellites of the adjacent lines “A” and “C” were moving closer to the line labeled “B,” as shown in Fig. 3(a). To get insight into the linewidth compression, we show temporal traces and RF spectra for the last four steps [labeled (15), (16), (17), and (18)] in Figs. 3(b) and 3(c), respectively. For position 15 in Figs. 3(b) and 3(c), the distance between the satellites is slightly less than 3 MHz and corresponds to the situation when the satellites completely vanish. The RF line corresponding to the fundamental comb frequency has changed in SNR from 6 to 30 dB. In position 16, the distance between satellites was diminished. In this position, the noise demonstrated a periodic pattern, and the RF spectrum became broader and had “three humps.” After the knob of POC2 has been turned again (position 17), the oscilloscope traces [Fig. 3(b), position 17] showed regularly modulated oscillations at 293.16 MHz and the bias period close to 20 ns (50 MHz). The RF spectrum now exhibited multiple peaks.
Finally, after the last rotation of the knob (position 18), the modulation disappeared, and the regular oscillations pattern at the frequency of 293.16 MHz became visible. The RF spectrum showed a unique narrow resonance line with 60 dB SNR. The noise level was at (limit of the RF analyzer), as shown in Fig. 3(c). The SOP is locked for POC2 positions 15 and 18 that correspond to the self-oscillation at the fundamental frequency (position 15) and HML (position 18). The adjustment of POC2 from position 15 to position 18 changes the linear and circular birefringence in the cavity due to induced fiber squeezing and twist [24]. As shown in Fig. 3(d), increasing the DOP from 62% (position 15) to 86% (position 18) indicates SOP variations suppression, so there is more stable operation for position 18 as compared to position 15. In addition to these results, we have observed locking at different acoustic frequencies, as shown in Table 1 of Appendix B. The tuning between different harmonics was performed by adjusting POC2.
B. Theoretical Results
The results of the theoretical analysis are shown in Figs. 4(a)–4(i). As follows from Figs. 4(a), 4(b) and 4(d), 4(e), the output powers I and , are oscillating at frequency [24], whereas oscillations at the frequency have almost been suppressed. Only for the case when the frequency is a multiple of frequency , the oscillations at the frequency disappear, and the output power is modulated at frequency . This is like the experimental data shown in Fig. 3, where HML is stabilized only when , i.e., when the satellites’ frequencies are matching the frequency spacing between harmonics. The HML mechanism looks like the vector mode-locking at the fundamental frequency [22]. By adjusting the in-cavity POC2, we were able to increase the circular birefringence strength that leads to the generation of two satellite lines around the harmonic frequency. When the birefringence-based modulation frequency approaches the fundamental frequency, the modulation of the harmonic at the frequency disappears, and is the activation results in modulation of the cavity mode with the frequency of . The amplitude of the output power [Fig. 4(g)] along with the Stokes parameters shown was small, and so SOP was locked [Fig. 4(i)].
![]()
Figure 4.Results of the numerical modeling. (a), (d), (g) The output power versus time for two linearly cross-polarized SOPs,
The trajectories on the Poincare sphere shown in Figs. 4(c) and 4(f) are different from those experimentally observed [Fig. 3(d)]. However, the in Fig. 3(d) indicates that the SOP evolves at the time scale faster than the polarimeter resolution of 1 μs and, after averaging over 10 roundtrips, can shrink to the dot at the Poincare sphere [11]. By using a low-pass filter with the Hanning window [transmission spectrum ], we have processed the time domain waveforms shown in Fig. 4(c) [25]. As a result, the SOP in the form of a circle was transformed to the dot with that is close to the experimental results. The suppression of the oscillations at the frequency ω indicates that the linewidth is narrowing due to oscillations only at the frequency [Fig. 4(h)].
While the ellipticity of the pump wave increased from to , the oscillations at the frequency were persisting, as shown in Figs. 5(a)–5(c). The increased ellipticity resulted in the reduced coupling of the orthogonal SOPs, so they prevented synchronization and the suppression of the oscillations at frequency .
![]()
Figure 5.Results of the numerical modeling. The difference as compared to Figs.
We highlight that the analysis of HML based on the excitation of provides just a qualitative approach to the linewidth suppression. The presence of oscillations of the output power at the frequency of the mode and cancelation of the oscillations at the frequency related to the linear and circular birefringence results in narrowing of the RF line and increased SNR of 30 dB. Quantification of the linewidth suppression at the fundamental and 293.16 MHz, 464.17 MHz, and 549.7 MHz harmonic frequencies would require an improved jitter model that accounts for the SOP, dispersion, and contribution of phonons excited by this comb through the electrostriction effect, and it lies beyond the scope of this paper.
5. CONCLUSION
In conclusion, we demonstrated a new vector HML mechanism experimentally confirmed for an EDF ring cavity. By adjusting the in-cavity POC and the pump power, we could switch the stable fundamental mode operation at 12.21 MHz to the HML operation at 293.16 MHz, 464.17 MHz, and 549.7 MHz along with linewidth narrowing from thousands of hertz (Hz) to a few Hz followed by 30 dB increase of the SNR. To explain stable HML mode operation and linewidth narrowing with increased birefringence strength, we developed a new vector model that accounts for the interplay of linear and circular birefringence with birefringence modulation caused by excitation of the radial-torsional acoustic mode. In the future extension of the vector model given in Appendix A, we will develop a vector model of jitter for MLFLs to quantify the linewidth narrowing and repetition rate tunability.
APPENDIX A: PULSE MEASUREMENT TECHNIQUE
The pulse duration was too large to be measured with an auto-correlator. To estimate the pulse parameters, we used an ultrafast photodetector XPDV232OR with a bandwidth of 50?GHz. This detector in turn was connected to a DSO-X93204A oscilloscope with a bandwidth of 32?GHz. The pulse width of 20?ps was obtained using the oscilloscope trace and the interpolation software supplied by Agilent. This algorithm gave us the effective resolution of 781?fs/point. The pulse energy was estimated to be 1.4?nJ. The time-bandwidth product (TBWP) was calculated to be 0.5 using the formula , where c is the speed of light, is the pulse duration, is the width of the optical spectrum and is the central optical wavelength. Since the TBWP for Gaussian pulse , we have assumed that pulses are slightly chirped.
APPENDIX B: HARMONIC FREQUENCIES
The experimentally observed harmonic frequencies are summarized in Table? Frequencies Observed in the Experiments Parts per million with respect to the main value of frequency. The jitter has been quantified using the ARIMA (0, 1, 0) (random walk with drift) model with the interval of confidence of 0.95. Asymmetric interval of confidence of 0.95 [min, mean, max]. At pump power of 220?mW.Frequency (MHz) RF Peak Width (Hz) Temporal Jitter (ppm) Long Term Drift 12,21 [210,370,530] 40 Yes 97.7 Unstable Unstable – 207.6 Unstable Unstable – 293.16 [9,38,155] 1.4 Yes 464.17 [22,38,150] 0.9 Yes 549.7 [1,13,97] 0.5 Yes 842.5 Unstable Unstable – 903.5 Unstable Unstable –
APPENDIX C: VECTOR MODEL OF Er-DOPED FIBER LASER
Evolution of the laser SOPs and population of the first excited level in the -doped active medium was modeled using the following equations derived from the vector theory developed by Sergeyev and co-workers [
Equation?(
Unlike the other vector models, the vector model in a more simple form with approximations considered in our previous publications [
To obtain results shown in Fig.?
References
[1] M. Dudley, F. Dias, M. Erkintalo, G. Genty. Instabilities, breathers and rogue waves in optics. Nat. Photonics, 8, 755-764(2014).
[2] P. Grelu, N. Akhmediev. Dissipative solitons for mode-locked lasers. Nat. Photonics, 6, 84-92(2012).
[3] W. Fu, L. G. Wright, P. Sidorenko, S. Backus, F. W. Wise. Several new directions for ultrafast fiber lasers. Opt. Express, 26, 9432-9463(2018).
[4] X. Liu, M. Pang. Revealing the buildup dynamics of harmonic mode-locking states in ultrafast lasers. Laser Photon. Rev., 13, 1800333(2019).
[5] M. Pang, X. Jiang, W. He, G. K. L. Wong, G. Onishchukov, N. Y. Joly, G. Ahmed, C. R. Menyuk, P. St.J. Russell. Stable subpicosecond soliton fiber laser passively mode-locked by gigahertz acoustic resonance in photonic crystal fiber core. Optica, 2, 339-342(2015).
[6] H. Leopardi, J. Davila-Rodriguez, F. Quinlan, J. Olson, J. A. Sherman, S. A. Diddams, T. M. Fortier. Single-branch Er:fiber frequency comb for precision optical metrology with 10−18 fractional instability. Optica, 4, 879-885(2017).
[7] G. Pu, L. Yi, L. Zhang, W. Hu. Intelligent programmable mode-locked fiber laser with a human-like algorithm. Optica, 6, 362-369(2019).
[8] T. Fortier, E. Baumann. 20 years of developments in optical frequency comb technology and applications. Commun. Phys., 2, 153(2019).
[9] N. Picqué, T. W. Hänsch. Frequency comb spectroscopy. Nat. Photonics, 13, 146-157(2019).
[10] A. B. Grudinin, S. Gray. Passive harmonic mode locking in soliton fiber lasers. J. Opt. Soc. Am. B, 14, 144-154(1997).
[11] H. J. Kbashi, S. V. Sergeyev, M. Al-Araimi, A. Rozhin, D. Korobko, A. Fotiadi. High-frequency vector harmonic mode locking driven by acoustic resonances. Opt. Lett., 44, 5112-5115(2019).
[12] M. Quiroga-Teixeiro, C. B. Clausen, M. P. Sørensen, P. L. Christiansen, P. A. Andrekson. Passive mode locking by dissipative four-wave mixing. J. Opt. Soc. Am. B, 15, 1315-1321(1998).
[13] T. Sylvestre, S. Coen, P. Emplit, M. Haelterman. Self-induced modulational instability laser revisited: normal dispersion and dark-pulse train generation. Opt. Lett., 27, 482-484(2002).
[14] M. Peccianti, A. Pasquazi, Y. Park, B. E. Little, S. T. Chu, D. J. Moss, R. Morandotti. Demonstration of a stable ultrafast laser based on a nonlinear microcavity. Nat. Commun., 3, 765(2012).
[15] D. Mao, X. Liu, Z. Sun, H. Lu, D. Han, G. Wang, F. Wang. Flexible high-repetition-rate ultrafast fiber laser. Sci. Rep., 14, 3223(2013).
[16] I. A. Lobach, S. I. Kablukov, E. V. Podivilov, A. A. Fotiadi, S. A. Babin. Fourier synthesis with single-mode pulses from a multimode laser. Opt. Lett., 40, 3671-3674(2015).
[17] F. Li, P. K. A. Wai, J. N. Kutz. Geometrical description of the onset of multipulsing in mode-locked laser cavities. J. Opt. Soc. Am. B, 27, 2068-2077(2010).
[18] R. M. Shelby, M. D. Levenson, P. W. Bayer. Guided acoustic-wave Brillouin scattering. Phys. Rev. B, 31, 5244-5252(1985).
[19] A. N. Pilipetskii, A. V. Luchnikov, A. M. Prokhorov. Soliton pulse long-range interaction in optical fibers: the role of light polarization and fiber geometry. Sov. Lightwave Commun., 3, 29-39(1993).
[20] I. Kim, K. J. Lee. Axial strain dependence of torsional acousto-optic gratings induced in a form-birefringence optical fiber. J. Korean Phys. Soc., 67, 465-471(2015).
[21] H. J. Kbashi, S. V. Sergeyev, M. Al Araimi, N. Tarasov, A. Rozhin. Vector soliton rain. Laser Phys. Lett., 16, 035103(2019).
[22] S. V. Sergeyev, H. Kbashi, N. Tarasov, Y. Loiko, S. A. Kolpakov. Vector-resonance-multimode instability. Phys. Rev. Lett., 118, 033904(2017).
[23] S. V. Sergeyev. Vector self-pulsing in erbium-doped fiber lasers. Opt. Lett., 41, 4700-4703(2016).
[24] E. Collett. Polarized Light in Fiber Optics(2003).
[25] S. V. Sergeyev, C. Mou, E. G. Turitsyna, A. Rozhin, S. K. Turitsyn, K. Blow. Spiral attractor created by vector solitons. Light Sci. Appl., 3, e131(2014).
[26] S. V. Sergeyev. Fast and slowly evolving vector solitons in mode-locked fibre lasers. Philos. Trans. R. Soc. A, 372, 20140006(2014).
[27] H. Zeghlache, A. Boulnois. Polarization instability in lasers. I. Model and steady states of neodymium-doped fiber lasers. Phys. Rev. A, 52, 4229(1995).
[28] S. V. Sergeyev. Spontaneous light-polarization symmetry breaking for an anisotropic ring-cavity dye laser. Phys. Rev. A, 59, 3909-3917(1999).
[29] V. A. Gaisenok, G. G. Krylov, S. V. Sergeyev. Dynamic operations of a dye laser with a saturable absorber: pumping anisotropy and orientational relaxation. Physica D, 72, 161-165(1994).

Set citation alerts for the article
Please enter your email address
© Copyright 2018-2021 | Chinese Laser Press. All Rights Reserved 沪ICP备15018463号-20