Polarimetric imaging provides valuable insights into the polarization state of light interacting with a sample. It can infer crucial birefringence properties of specimens without using labels, thereby facilitating the diagnosis of diseases such as cancer and osteoarthritis. In this study, we present a novel polarimetric coded ptychography (pol-CP) approach that enables high-resolution, high-throughput gigapixel birefringence imaging on a chip. Our platform deviates from traditional lens-based systems by employing an integrated polarimetric coded sensor for lensless coherent diffraction imaging. Utilizing Jones calculus, we quantitatively determine the birefringence retardance and orientation information of biospecimens from the recovered images. Our portable pol-CP prototype can resolve the 435 nm linewidth on the resolution target, and the imaging field of view for a single acquisition is limited only by the detector size of 41 mm2. The prototype allows for the acquisition of gigapixel birefringence images with a 180 mm2 field of view in , a performance that rivals high-end whole slide scanner but at a small fraction of the cost. To demonstrate its biomedical applications, we perform high-throughput imaging of malaria-infected blood smears, locating parasites using birefringence contrast. We also generate birefringence maps of label-free thyroid smears to identify thyroid follicles. Notably, the recovered birefringence maps emphasize the same regions as autofluorescence images, underscoring the potential for rapid on-site evaluation of label-free biopsies. Our approach provides a turnkey and portable solution for lensless polarimetric analysis on a chip, with promising applications in disease diagnosis, crystal screening, and label-free chemical imaging, particularly in resource-constrained environments.
Author Presentation Playback
视频暂时无法播放,请稍后刷新重试 #007.4
00:00
00:00/01:21:07
弹幕
vr模式
超清
高清
流畅
自动
2x
1.5x
1.2x
1x
0.5x
字幕
模式
视频音频
线路
vr模式
裸眼眼镜
播放器
FlashHTML5
画中画
网页全屏
全屏
Version:v1.62.1
由酷播云提供服务
1. INTRODUCTION
Polarimetric imaging has attracted considerable interest in the field of biomedicine, owing to its ability to unveil structural and chemical information that often remains undetected by conventional imaging techniques [1,2]. A notable benefit of polarimetric imaging is its application in label-free biospecimen characterization. By analyzing the polarization properties of light interacting with biospecimens, microscopic-level information about the composition and structure can be obtained without requiring labeling agents. For example, collagen fibers in connective tissues can alter the polarization state of light passing through them. Measuring this alteration provides information about collagen fiber orientation and density, which are associated with various diseases such as cancer and fibrosis [3,4]. Another advantage of polarimetric imaging is image contrast enhancement. By selectively filtering out light waves with certain polarization states, it is possible to enhance image contrast and improve the visibility of certain structures or components based on the birefringence maps. For example, birefringence maps have been used to locate and identify malaria hemozoin crystals generated from the hemoglobin metabolism process of malaria parasites [5]. Similarly, birefringence maps have shown clinical value in screening and imaging meiotic spindles [6], monosodium urate [7], squamous cell carcinoma [8,9], articular cartilage [10], cerebral amyloid [11], normal versus cancer cells [12], among others. These diverse applications demonstrate the potential of polarimetric imaging in enhancing diagnostic accuracy and facilitating the early detection of various medical conditions.
Conventional lens-based polarization light microscopy utilizes a polarizer-analyzer pair to measure the changes in the polarization state of light induced by the sample. Despite widespread use in different application settings, there are several limitations of these lens-based systems. One significant drawback is the trade-off between the spatial resolution and the imaging field of view. One can obtain high resolution with a small field of view or low resolution with a large field of view, but not both [13,14]. To obtain a high-resolution whole slide image of the sample, integration of the polarization optics with a whole slide imaging system is necessary for data acquisition. However, this integration remains elusive as whole slide scanners are often dedicated and costly tools [15,16]. Additionally, high numerical aperture (NA) objective lenses imply a small depth of field, typically on the micrometer scale, which presents a challenge when tracking the axial topography variations of biospecimen. If the sample is not positioned within the objective lens’s small depth of field, the image quality will degrade, necessitating rescanning and causing workflow delays [15]. Further, the specialized and nonportable nature of whole slide scanner creates obstacles that prevent its widespread use in different application settings, particularly in resource-constrained environments.
To address these limitations, researchers have developed alternative methods for polarimetric imaging. One notable advancement is in the domain of conventional real-space ptychography, where researchers have integrated a vectorial imaging framework to enable the characterization of anisotropic media [17–19]. This development enables mapping of the four parameters of the Jones matrix and can be used to quantify optical material properties. Another example is the lens-based Fourier ptychographic microscopy (FPM) [20] implemented with a pixelated polarization camera [21]. In this case, the achieved spatial resolution is no longer constrained by the NA of the objective lens but determined by the largest incident angle. Consequently, a half-pitch resolution of 0.55 μm has been demonstrated over a field of view of 3.78 mm2 in a polarization-sensitive FPM system, corresponding to a moderate space bandwidth product of megapixels [21]. Similarly, vectorial FPM has been demonstrated by placing a generator polarizer at the illumination path and an analyzer at the detection path [22]. With four generator-analyzer configurations, the object’s Jones matrix can be recovered from the low-resolution raw measurements.
While these previous demonstrations provide new insights for polarimetric imaging, the achieved imaging throughput is still orders of magnitude lower than that of a whole slide scanner [15,23]. Moreover, real-space ptychography and FPM rely on coded illumination, and their imaging models are contingent upon how the incident beam enters the sample [14,24–26]. As a result, thick specimens frequently pose a challenge to these modalities, necessitating an accurate model of the light-sample interaction process [27–29]. This same challenge also applies to other lensless ptychographic implementations that utilize speckle or multiangle illumination [30–35]. The quality of the recovered images often falls short when compared with that of conventional bright-field polarization microscopy.
Another alternative to conventional lens-based polarization light microscopy is to perform polarimetric imaging based on in-line holographic acquisitions [36–40]. For example, multiheight holographic measurements have been implemented with a polarizer–analyzer pair for lensless polarimetric imaging, demonstrating potentials for biomedical applications [36]. However, the traditional multiheight phase-retrieval technique may not provide sufficient diversity measurements for recovering complex objects with intensity and phase properties [41]. Specifically, recovering biospecimens containing phase wraps, such as bacterial colonies or cytology smears, is a challenging task for the in-line holographic implementation [41,42]. This difficulty arises because the object’s phase information cannot be effectively converted into intensity variations for detection, i.e., the phase transfer function approaches zero at certain frequency bands [24,43,44]. Moreover, existing holographic imaging implementations still face constraints in spatial resolution, field of view, and imaging throughput when compared with robotic microscope platforms.
In this work, we present a novel polarimetric coded ptychography (pol-CP) technique that enables high-resolution, high-throughput gigapixel birefringence imaging on a chip. Instead of using conventional lens-based polarization optics, our platform adopts the concept of coded ptychography for high-resolution, high-throughput coherent diffraction imaging with a disorder-engineered surface [42,44–50]. In our implementation, we illuminate the specimen with circularly polarized laser light and attach an ultrathin polarizer film to a blood-coated sensor for image acquisition. The integrated coded sensor is then mounted on a compact, customized stage, enabling control over both rotational and translational motions. By analyzing four different polarization states with Jones calculus, we retrieve the quantitative birefringence retardance and orientation information of the specimen. Our cost-effective and handheld pol-CP prototype can resolve the 435 nm linewidth on the resolution target, with the field of view of a single acquisition limited only by the size of the sensor, i.e., approximately 41 mm2. Utilizing this prototype platform, we demonstrate that gigapixel birefringence images with a 180 mm2 field of view can be acquired in approximately 3.5 min, a performance that rivals high-end whole slide scanner but at a small fraction of the cost. In contrast with conventional lens-based polarization microscopy, our platform enables image refocusing after data acquisition, effectively addressing the autofocusing issue present in traditional whole slide scanners. Furthermore, the reported technique models only the complex wavefront exiting the sample, not its entry, rendering sample thickness inconsequential in the image formation process. Unlike conventional real-space ptychography, FPM, and other common ptychographic implementations, which necessitate thin sample assumptions, our platform eliminates this constraint. Given these advantages, we anticipate that this approach will find widespread applications in disease diagnosis, crystal screening, and label-free chemical imaging, particularly in resource-constrained environments.
2. MATERIALS AND METHODS
A. Polarimetric Coded Ptychography (pol-CP) on a Chip
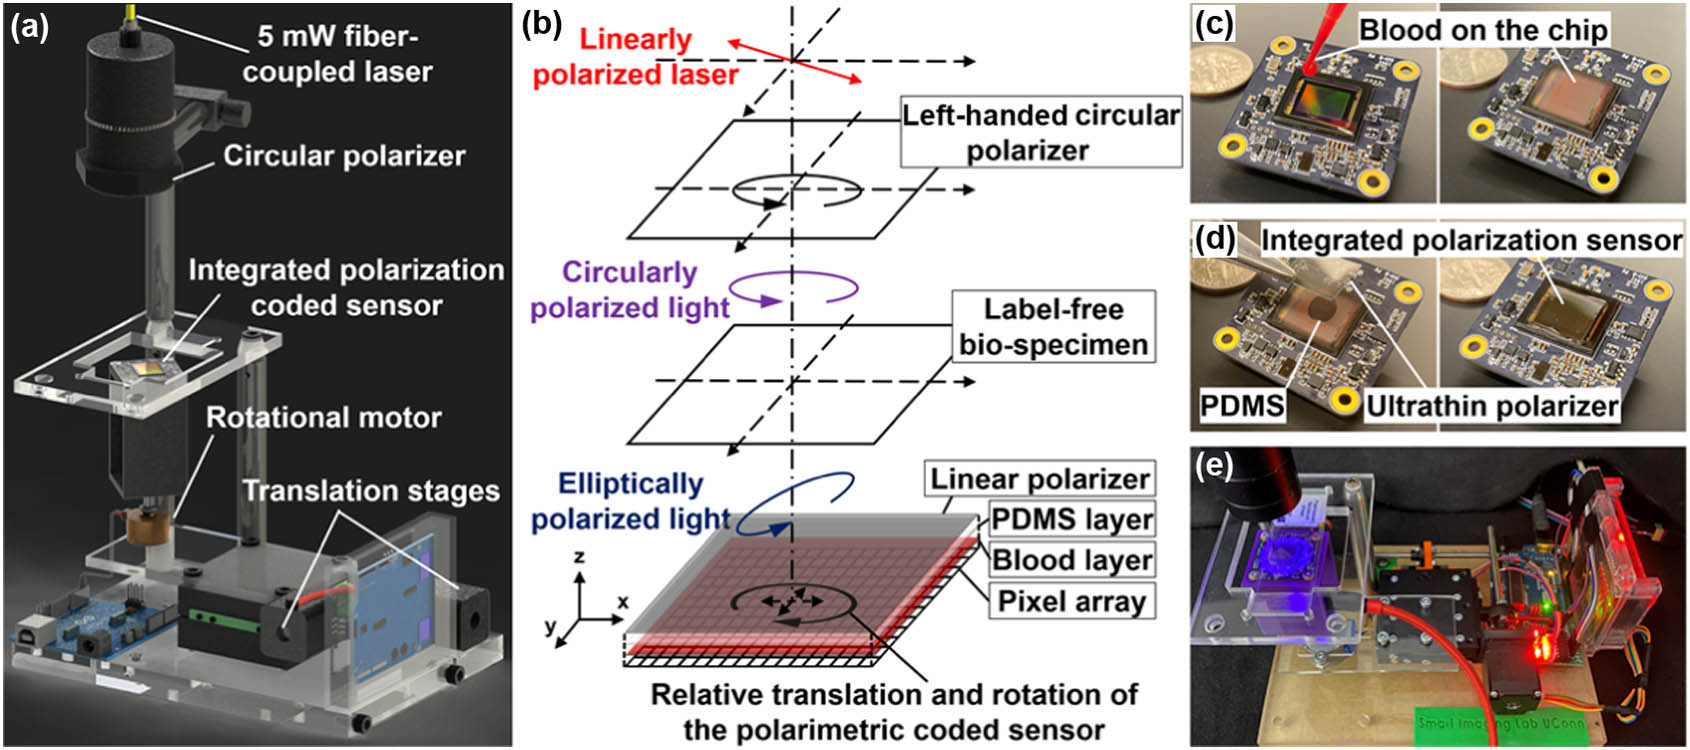
Figures 1(a) and 1(b) illustrate the schematic of our pol-CP prototype setup. This prototype consists of three main components (from top to bottom): the illumination light source; the integrated polarimetric coded sensor; and the motion system for programmable translation and rotation control. As shown in Fig. 1(a), a fiber-coupled, 5 mW 405 nm laser diode serves as our light source. Positioned upstream of the sample, a left-handed circular polarizer converts the linearly polarized light from the laser into circularly polarized light for sample illumination. The use of laser diode in pol-CP offers superior spatial and temporal coherence compared with conventional LED-based lensless setups. It also ensures adequate illumination intensity for a short exposure time of for image acquisition. This allows the coded sensor to operate in continuous motion without occurrence of motion blur issues.
Figure 1.Schematic diagram and operation of the lensless polarimetric coded ptychography (pol-CP) platform. (a) A circular polarizer transforms linearly polarized light from the laser diode into circularly polarized light, which then interacts with the specimen. The exit wave is recorded by the integrated polarimetric coded image sensor. (b) Illustration of changes in the polarization state within the pol-CP system. (c) A 2 μL sample of goat blood is smeared onto the sensor’s coverglass and fixed with ethyl alcohol, forming a thin and dense blood-cell layer that acts as a high-performance scattering lens with a theoretically unlimited field of view. (d) An ultrathin polarizing film is adhered to the blood-cell layer, forming an integrated polarimetric coded image sensor. (e) The pol-CP prototype features a polarimetric coded sensor mounted on programmable stages, allowing control over both rotational and translational motions.
The imaging system of pol-CP features an integrated polarimetric coded image sensor. In our implementation, we smeared a drop of goat blood on the sensor’s coverglass followed by cell fixation with ethyl alcohol [Fig. 1(c)]. We select goat blood because of its 2–3 μm red blood cell size, which is the smallest among all animals. The smearing process naturally creates a thin, uniform, and dense monolayer of blood cells on the sensor’s coverglass for light wave modulation. This blood-cell layer serves as the effective ptychographic probe beam within the pol-CP setup [24]. Alternative solutions include disorder-engineered surface, microbeads, and metasurface [42,44,49,50]. We note that the fabrication process of this goat-blood layer can be completed in with minimal cost; notably, it does not require the use of complex lithographic tools typically required for the construction of metasurfaces or disorder-engineered surfaces [42,44]. In our pol-CP prototype, we used a drop of polydimethylsiloxane (PDMS) liquid to attach an μ polarizing film to the coded sensor, as shown in Fig. 1(d). The use of PDMS ensures a secure attachment between the polarizing film and the blood-cell layer, thus forming an integrated polarimetric coded sensor capable of high-resolution ptychographic imaging. As shown in Fig. 1(b), when the specimen exhibits optical anisotropy, the transmitted light becomes elliptically polarized and is subsequently collected by the integrated coded sensor.
The motion system of our prototype device is shown in the bottom panel of Fig. 1(a). We used stepper motors to build a compact motorized stage capable of managing translational and rotational motion controls. Figure 1(f) shows the entire pol-CP prototype platform. The operation of the entire platform can be viewed in Visualization 1.
B. Imaging Model and Reconstruction
Figure 2 shows the data acquisition and reconstruction process of pol-CP. In the data acquisition process, the integrated polarimetric coded sensor is rotated to four specific angles (, 45°, 90°, 135°). At each angle, a set of lensless diffraction data is obtained by translating the coded sensor to different lateral positions . The four sets of measurements, labelled as in Fig. 2(a), are subsequently utilized to recover four high-resolution images corresponding to different polarization states, as displayed in Fig. 2(b). From these recovered intensity images, the optic axis orientation and retardance maps can be derived using Jones calculus, as demonstrated in Figs. 2(c)–2(e).
Figure 2.Image acquisition and reconstruction process of pol-CP. (a) The captured four sets of raw images with the integrated coded sensor at four different orientations. (b) The recovered four images with the 0° orientation as the reference. (c), (d) The optic axis orientation and retardance maps are derived using Jones calculus. (e) A pseudo-colored birefringence map by encoding the optic axis orientation as color hue and the retardance information as intensity.
The forward imaging model of pol-CP is discussed as follows. Initially, the input left-handed circularly polarized light interacts with the sample, producing a wave field that travels a distance between the sample and the integrated coded sensor. This wave field is then modulated by the linear polarizing film affixed to the integrated coded sensor. The imaging process above can be written as where represents matrix multiplication, and represents convolution operation applied element-wise to each component of the matrix. In Eq. (1), , representing the Jones vector of the input circularly polarized light with intensity . The term represents the convolution kernel for free space propagation over a distance . Within this equation, and correspond to the Jones matrices of the birefringent sample and the linear polarizer orientated at angle , respectively. Specifically, the Jones matrix of the sample can be expressed as Here, the symbol denotes element-wise multiplication. For brevity, the spatial coordinates are omitted in the retardance magnitude and the slow axis orientation in Eq. (2). On a related note, the Jones matrix of the linear polarizer, represented as , is given by
In this equation, signifies the orientation angle of the linear polarizing film on the coded sensor. By rotating the entire coded sensor assembly, we can change to different angles in the image acquisition process. We also note that remains constant in our implementation, implying that is spatially invariant across different positions. This stands in contrast to commercially available polarized sensors, such as Sony IMX 250MZR, which incorporates polarizers with four different angles over different sensor pixels.
In the second step of the imaging process, the light field emerging from Eq. (1) is further modulated by the blood-cell layer at the coded surface plane. The resultant light field then travels a distance between the coded surface and the pixel array. The captured intensity image can be expressed as Here, represents the th captured image corresponding to the sensor positional shift . The superscript of represents the orientation angle of the integrated coded sensor. represents the transmission profile of the coded surface, and represents -fold downsampling by the pixel array. The multiplication and convolution operations are carried out element-wise on the respective components of the vector. Finally, the captured image is obtained by taking the square magnitude of the resulting value in Eq. (4).
The reconstruction process of pol-CP aims to recover the retardance magnitude and the slow axis orientation in Eq. (2), leveraging the four sets of intensity measurements at orientation angles , 45°, 90°, 135°. In this process, we first recover the lateral positional shift directly from the captured raw images [51]. We then recover the scalar wavefront at the coded surface plane where represents the phase term of the scalar exit wavefront at the coded surface plane. The comprehensive recovery process for is elaborated in Appendix A. This process commences with an initialization phase that employs digital inline holographic reconstruction, followed by the coded ptychographic phase-retrieval process [52]. Upon obtaining , we digitally propagate it back to the sample plane and obtain the scalar sample wavefront as follows:
Subsequently, we rotate and align with respect to , obtaining in Appendix A. For image rotation, we implemented a three-step shearing process in the Fourier domain [53]. For image registration, we estimate the residual transverse shift and rotation angle via a closed-form equation, as detailed in Appendix A. With the equations above, we arrive at the subsequent expressions for :
With Eqs. (7)–(10), we can recover the spatial distribution of retardance magnitude and the optic axis of the birefringent sample as follows:
Here, and are intermediate variables, defined as
To improve visualization of the reconstructed image, a pseudo-colored birefringence map can be obtained by encoding the optic axis orientation as color hue and the retardance information as intensity, as shown in Fig. 2(e).
3. RESULTS
A. Imaging Performance Characterization
We assessed and quantified the imaging performance of the pol-CP prototype using three types of objects: a resolution target (Fig. 3); a quantitative phase target (Fig. 4); and a potato starch granules sample (Fig. 5). A calibration experiment was designed to determine the transmission profile of the blood-coded layer on the integrated sensor. For this experiment, we selected an object devoid of slow-varying phase, typically a blood smear slide, and acquired images by translating the coded sensor across various lateral positions. These images assisted in recovery of the object and the blood-coded layer on the sensor. Once the blood-cell layer is obtained, it becomes feasible to use it for subsequent experiments, reducing the number of required images to to cover one field of view (41 mm2) of the detector.
Figure 3.Image quality quantification using a USAF resolution target. (a) The captured raw image of the resolution target. (b) The recovered image using the pol-CP platform. The recovered intensity (c1) and phase (c2) images of the blood-cell layer on the integrated coded sensor. The goat blood cells are smallest among all animals.
Figure 4.Validating the pol-CP prototype using a quantitative phase target. The recovered (a) amplitude, (b) phase, and (c) color-coded birefringence map.
Figure 5.Validation of the pol-CP prototype by imaging potato starch granules. (a) The captured raw diffraction measurement of the potato starch granules. (b) The reconstructed optic axis orientation using the pol-CP prototype. (c)–(e) Zoomed-in views of the highlighted regions of (b). The line traces show the measurements using the pol-CP prototype (black dotted line) and the conventional lens-based polarized light microscopy with a , 0.45 NA objective (red dotted line).
Figure 3(a) shows the captured raw image of the resolution target; Fig. 3(b) shows the recovered image using the pol-CP prototype. The 435 nm linewidth of group 10, element 2 on the target is clearly visible in the recovered image. This level of detail is particularly remarkable considering the pixel size of the detector in the captured raw image is 1.85 μm. It is worth mentioning that the achieved resolution in our demonstration of Fig. 3(b) ranks among the highest in lensless polarimetric imaging studies. The achieved resolution is also higher than the lens-based FPM demonstrations [21,22] while enabling orders of magnitude larger field of view. In Fig. 3(c), we present the recovered intensity and phase profiles of the blood-cell layer on the sensor, demonstrating the presence of a densely packed monolayer of goat blood cells. This blood-cell layer plays a crucial role in intensity and phase modulation, contributing to the successful high-resolution recovery of birefringent objects [44].
To validate the quantitative nature of the pol-CP platform, we extended our evaluation of the pol-CP prototype by imaging a quantitative phase target. Figures 4(a) and 4(b) show the recovered amplitude and phase of the target. Figure 4(c) presents the recovered birefringence map of the phase target, confirming the absence of retardation within the sample.
In Fig. 5, we validated the pol-CP prototype with potato starch granules, which exhibit strong birefringence due to the high radial orientation of amylopectin crystallites. Figures 5(a) and 5(b) show the raw image and the reconstructed optic axis orientation of the granules using the pol-CP prototype. Figures 5(c)–5(e) provide magnified views of the three highlighted regions in Fig. 5(b). To validate the accuracy of our pol-CP prototype, we also reconstructed the optic axis orientation using the gold standard lens-based polarized light microscopy (ground truth). In this experiment, a , 0.45 NA objective was used to acquire images. The agreement between our lensless prototype (red curves) and the ground truth (black curves) in the right panels of Fig. 5(c) validates the effectiveness of the pol-CP approach.
B. High-Resolution Gigapixel Birefringence Imaging over a Large Field-of-View
Conventional lens-based polarized light microscopy [54] has a limited space-bandwidth product that restricts its ability to deliver both high resolution and a large field of view [13]. Our lensless pol-CP prototype offers a solution to this limitation, thus obtaining the best of both worlds. The imaging field of view of a single acquisition is limited only by the size of the image sensor. The lateral translation of the coded sensor naturally expands the field of view, enabling polarimetric whole slide imaging in high throughput. In our implementation, we typically acquire 250 images in for one field of view of the detector. By translating and rotating the coded sensor to different lateral positions and orientations, we can obtain gigapixel birefringence images with a 180 mm2 field of view in approximately 3.5 min, a performance that rivals high-end whole slide scanner but at a small fraction of the cost [15]. As an example, Figs. 6(a) and 6(b) show the raw image and recovered gigapixel birefringence map of a whole slide potato starch granule sample. Figures 6(c)–6(f) show the magnified views of four different regions, where we compare the raw measurements with the recovered amplitude, optic axis orientation, retardance, and color-coded birefringence map.
Figure 6.High-resolution, large field-of-view gigapixel birefringence imaging via pol-CP. (a) The captured raw image of the whole-slide starch grain sample. (b) The recovered birefringence map. (c)–(f) The magnified views of different regions in (b). (c1)–(f1) The captured raw images. (c2)–(f2) The recovered amplitude. (c3)–(f3) The recovered optic axis orientation. (c4)–(f4) The recovered retardance. (c5)–(f5) The birefringence maps where the color scale is used to encode the optic axis orientation and the gray scale is used to encode the retardance information.
C. Imaging with Quantitative Polarimetric and Phase Contrast
Achieving good image contrast in microscopy is crucial for the study of specimen structure and enhancing diagnostic capabilities. While various methods exist to enhance image contrast in microscopy, such as fluorescence microscopy, darkfield microscopy, and differential interference contrast (DIC) microscopy, these techniques often lack the ability to provide quantitative information about the specimens without the need for external staining. For instance, fluorescence microscopy requires the application of external dyes or tags, which can potentially produce toxic byproducts or lead to photobleaching. On the other hand, darkfield and DIC microscopy can enhance image contrast, but their outputs are predominantly qualitative in nature. Unlike other common microscopy modalities, the lensless pol-CP platform offers a unique solution by generating the quantitative phase contrast and polarimetric contrast of the specimens at a high imaging throughput. The quantitative phase information is directly related to the morphology of the sample while the quantitative polarimetric contrast provides insights into the intrinsic chemical composition of the specimen.
This capability is demonstrated through the analysis of a corn stem sample in Fig. 7. In Figs. 7(a)–7(d), we show the raw image, recovered amplitude, recovered optic axis orientation, and quantitative birefringence map of the corn stem. The plant cells in this specimen are composed of parallelly arranged cellulose structures, thereby exhibiting the expected birefringence property. In Figs. 7(e)–7(g), we further show the zoomed-in views of three highlighted regions of Fig. 7(a). Figures 7(e1)–7(g1) show the captured raw diffraction patterns, and Figs. 7(e2)–7(g2) show the recovered amplitude and phase images of the wavefront . We note that the recovered phase here is intrinsically tied to the polarization state. Figures 7(e3)–7(g3) show the zoomed-in views of the recovered optic axis orientation, retardance, and color-coded birefringence map. We can see that the orientations of the cell match well with the optic axis displayed in color. The retardance of the cell is much higher than the background due to the different optical and structural properties. The birefringence map, which encodes optic axis orientation and retardance information, significantly improves the contrast and makes it possible to visualize fine details of the cell that would otherwise be obscured by the background in amplitude maps. The ability to generate phase contrast and polarimetric contrast in a single imaging technique holds great value for a wide range of applications, providing researchers with new insights into the structural and chemical properties of specimens without the need for external staining. This capability opens up new possibilities for studying a wide range of samples, from biological specimens to materials science applications, with enhanced accuracy and precision.
Figure 7.High contrast background-free imaging of a corn stem sample. (a) Captured raw image of corn stem. (b)–(d) The recovered amplitude, optic axis orientation, and birefringence map of (a). (e1)–(g3) Enlarged raw images of the highlighted regions in (a). (e1)–(g1) Raw images. (e2)–(g2) The recovered amplitude and phase of the wavefront at . (e3)–(g3) The reconstructed optic axis orientation, retardance, and birefringence map.
The lensless pol-CP platform can be a valuable tool for malaria diagnosis in resource-limited settings. When a malaria parasite infects a red blood cell (RBC), changes occur in its hemoglobin content, affecting the birefringence property of the cell. As the parasite grows, it crystallizes hemoglobin into hemozoin, which exhibits high birefringence. Leveraging polarimetric imaging, the pol-CP platform can effectively track and detect malaria-infected RBCs by detecting the hemozoin crystals.
In Fig. 8, we analyze the capability of the pol-CP platform for detecting hemozoin crystals on a blood smear sample infected with Plasmodium falciparum, a particularly harmful type of malaria parasite. Figure 8(a) shows the recovered high-resolution, large-field-of-view phase map of the blood smear slide. Three zoomed-in views of Fig. 8(a) are provided in Figs. 8(b)–8(d). The raw images and reconstructed birefringence maps presented in the first two images are overlaid in the last column of Figs. 8(b)–8(d). The presence of hemozoin crystals inside infected cells allows for clear identification, enabling the visualization of the structure and birefringence of malaria-infected blood cells in high resolution. This capability of the pol-CP platform provides a promising avenue for a wide range of biomedicine-related applications, benefiting from its high-sensitivity birefringence imaging capability as well as its ability to deliver high-resolution and large field-of-view imaging.
Figure 8.Detecting malaria-infected blood cells using the lensless pol-CP prototype. (a) The recovered phase image of the sample. (b)–(d) The zoomed-in views of the raw diffraction measurements (left column), quantitative birefringence maps (middle column), and overlaid images of phase and birefringence maps (right column).
Crystal imaging plays a vital role across various scientific and industrial domains, such as materials science, pharmaceuticals, and geology. The ability to visualize and analyze crystals with quantitative polarimetric contrast offers profound insights into their physical attributes, chemical composition, and multifaceted applications. One prominent example lies in the medical field’s analysis of urine samples. Urine samples often contain diverse crystal types, including calcium phosphate, calcium oxalate, uric acid, and cystine. These are influenced by factors such as an individual’s diet, hydration level, and underlying health conditions. The presence and classification of these crystals can be symptomatic of specific diseases or disorders. For example, calcium oxalate crystals may indicate a susceptibility to kidney stones, uric acid crystals might suggest gout or metabolic disorders, and cystine crystals could reveal a rare genetic condition known as cystinuria, leading to cystine stones in the kidneys, bladder, and urethra. The ability to accurately image and analyze these crystals over a large field of view and with polarimetric contrast can provide valuable diagnostic information. It enables healthcare providers to identify the specific type of crystals present, assess their concentration, and understand their formation conditions. This information can guide treatment decisions, such as dietary modifications, medication adjustments, or further diagnostic testing.
To demonstrate the capability in crystal structure visualization, we imaged a sediment slide prepared from urine samples and identified calcium phosphate crystals, as shown in Fig. 9. The captured raw images of the crystals are shown in Fig. 9(a); the recovered intensity images at four distinct polarization angles are shown in Fig. 9(b). Figure 9(c) reveals the recovered birefringence maps of the calcium phosphate crystals. Another key advantage of the reported platform resides in its ability to perform digital refocusing after the data have been acquired. We substantiated this aspect using a calcium phosphate crystal sample, as shown in Fig. 9(b3). Visualization 2 further shows the digital propagation process of the recovered wavefront.
Figure 9.Imaging of calcium phosphate crystal prepared from urine samples. (a1)–(a3) The captured raw images. (b1)–(b3) The recovered amplitude images at four polarization angles. (c1)–(c3) The recovered birefringence maps.
F. Label-Free Chemical Imaging of Cytological Smears
Tissue samples are naturally transparent under a conventional light microscope. Staining is commonly employed to enhance visibility by adding color to specific structures or features within a sample. While staining can aid in differentiation between different cell types or tissues, it is time-consuming for rapid on-site diagnostics and can potentially damage delicate structures. In contrast, our platform can provide label-free, intrinsic contrast by utilizing the polarization properties of biological specimens. To highlight this, we imaged an unstained thyroid smear using our prototype device, as shown in Fig. 10. Figures 10(a)–10(d) show the captured raw image, recovered amplitude, recovered birefringence map, and DAPI autofluorescence map of the unstained thyroid smear, respectively. In particular, Fig. 10(c) shows differential contrast arising from calcium oxalate crystals [55]. We note that these crystals are present within the colloid of normal thyroid follicles; they also contribute to the birefringence properties, as shown in purple color in Fig. 10(c). Interestingly, the autofluorescence image captured using a regular fluorescence microscope with a DAPI filter cube highlights the same areas. This is consistent with the autofluorescence emission signal in a similar range from calcium oxalates [56]. The results demonstrated here can be used to locate follicles on unstained cytology smears for rapid on-site evaluation.
Figure 10.Imaging of an unstained thyroid sample using the lensless pol-CP prototype. (a) Captured raw image. (b) Recovered amplitude. (c) Recovered birefringence map, where the calcium oxalate crystals are present within the colloid of thyroid follicles and contribute to the purple color in the birefringence map. (d) Captured autofluorescence image captured using a regular fluorescence microscope with a DAPI filter cube. The bright region indicates the autofluorescence signals from calcium oxalates. The results demonstrated here can be used to locate follicles on unstained cytology smears for rapid on-site evaluation.
In this study, we introduced polarimetric coded ptychography (pol-CP) as a solution to the existing challenges of conventional lens-based polarization microscopy, overcoming the trade-off between spatial resolution and imaging field of view as well as the constraints in cost, spatial resolution, field of view, and imaging throughput compared with robotic microscope platforms. Our work bridges the gap between the current limitations of conventional polarimetric imaging and the need for high-throughput, high-resolution imaging systems in biomedicine and beyond. Through the integration of a coded sensor and an ultrathin polarizer film, we achieved the acquisition of gigapixel birefringence images with a 180 mm2 field of view in a time frame comparable with regular whole slide scanners. Notably, this was achieved in a cost-effective and portable manner without using any lens, rendering the platform highly suitable for field and resource-limited applications.
In practical applications, the pol-CP platform exhibited potential in malaria diagnosis by effectively tracking and detecting malaria-infected red blood cells. The birefringence changes associated with the infection process, particularly the formation of hemozoin crystals by the parasite, were effectively identified and visualized using our platform. Moreover, we demonstrated pol-CP’s versatility in the realm of crystal imaging, particularly in the medical diagnosis of conditions indicated by the presence of specific crystals in urine samples. The platform’s ability to provide detailed structural information through birefringence mapping offers insights into the type, concentration, and formation conditions of these crystals, thereby aiding in more accurate and timely treatment decisions. Our platform’s potential was also highlighted in the label-free chemical imaging of unstained thyroid smears. Leveraging the inherent polarization properties of biological specimens, our platform offered intrinsic contrast, mitigating the need for time-consuming and potentially damaging staining processes. This ability can significantly enhance the efficiency and preservation of sample integrity in diagnostic processes, providing advancements for on-site rapid evaluations.
Compared with conventional real-space ptychography, pol-CP employs a coded detection scheme. In our system, the coded surface serves as an “effective” probe beam for the diffracted object light waves, analogous to the structured illumination probe beam in conventional ptychography. This coded detection scheme offers several advantages, such as micrometer-scale scanning steps between adjacent acquisitions, thereby maximizing imaging throughput at the full camera bandwidth. Furthermore, it eliminates the “thin sample” constraint commonly encountered in conventional real-space ptychography. Our polarimetric coded surface is a precalibrated, integral component of the system, ensuring consistent performance across all subsequent experiments.
When contrasted with FPM, pol-CP employs an extended laser beam that covers the entire sample slide without the photon budget issue. The millisecond short exposure time and the small scanning step size eliminate the motion blur issue, enabling continuous image acquisition at the camera’s full frame rate. In contrast, FPM often uses an LED array for illumination, which becomes a bottleneck for darkfield images requiring longer exposure times. In addition, FPM is susceptible to spatially variant pupil aberrations, particularly when using low-NA objective lenses. This results in compromised image quality toward the edge of the field of view. The reported pol-CP does not suffer from this shift-variant challenge, generally yielding better image quality.
The pol-CP prototype platform also excels in its ability to refocus images after data acquisition, effectively addressing the autofocusing issue associated with traditional whole slide scanners. This ability enhances image quality, streamlines workflow, and minimizes the need for rescanning due to autofocusing errors. The elimination of the need to model the complex wavefront entering the sample, a constraint present in other methods such as conventional real-space ptychography and FPM, increases flexibility, particularly in working with thick specimens [24].
The ultimate resolution of pol-CP is fundamentally constrained by the system’s maximum collection angle. In an ideal scenario where a point-object is placed proximate to the coded surface’s center and the detector’s pixel size is smaller than half the wavelength, the maximum collection angle could approach 90°, equating to a numerical aperture (NA) of 1 in air. However, real-world limitations such as the detector pixel’s sensitivity to obliquely incident light and its large size relative to the wavelength introduce constraints. These factors essentially act as low-pass filters and subsampling mechanisms, thereby limiting the achievable resolution. In our previous work, the highest NA achieved was approximately [44]. In the current study, the NA is 0.61, possibly due to the additional distance introduced by the polarizing film between the object and the coded surface. The goat-blood layer may also be suboptical compared with the fabricated disorder-engineered surface. However, it is worth noting that the achievable NA already surpasses those demonstrated in FPM using objective lenses. To further improve the resolution, a future direction is to perform oil-immersion imaging by placing oil in-between the object and the coded surface. Another strategy is to employ an angle-varied plane wave for sample illumination and then perform aperture synthesizing as in FPM. With large-angle illumination, it is possible to achieve an NA of close to 2 while retaining the field of view of the detector.
It is also worth noting that the use of circularly polarized light in the current prototype could introduce ambiguity in distinguishing between retardance values of 0 and . We opted for circularly polarized illumination primarily for its ease in facilitating birefringence recovery across individual analysis channels, thereby obviating the need for intricate polarization calibration procedures. Importantly, in the realm of biological samples, retardance values seldom exceed [57,58]. When regions with -retardance do occur, they are typically bordered by areas with retardance values either less than or greater than . This spatial context aids in resolving any ambiguity, akin to the phase unwrapping techniques that rely on surrounding phase values to accurately determine the correct phase wrap. Looking ahead, one avenue for future research could involve the adoption of elliptically polarized illumination, which would necessitate a comprehensive calibration procedure to fully characterize the polarization state.
In conclusion, the pol-CP technique exhibits promise for the future of polarimetric imaging in the biomedical field. Its high-throughput imaging, high spatial resolution, low cost, portability, and flexibility with sample thickness anticipate its valuable role in disease diagnosis, sample screening, and label-free chemical imaging. We look forward to the continued development and application of this technique, bearing in mind that further work is required for its refinement, standardization, and exploration of utility in a broader range of biomedical applications.
Acknowledgment
Acknowledgment. X. Shao acknowledges the support of the National Natural Science Foundation of China.
APPENDIX A: RECONSTRUCTION PROCEDURES OF POL-CP
The reconstruction procedures of pol-CP contain three major steps: 1) iterative ptychographic phase retrieval; 2) image rotation; 3) translation and rotation refinement.
Step 1. Ptychographic phase retrieval for object wavefront reconstructionSystem.Xml.XmlElementSystem.Xml.XmlElementSystem.Xml.XmlElementSystem.Xml.XmlElementSystem.Xml.XmlElementSystem.Xml.XmlElementSystem.Xml.XmlElementSystem.Xml.XmlElementSystem.Xml.XmlElementSystem.Xml.XmlElement
Step 2. Image rotation via Fourier transform
A general 2D clockwise rotation of the point onto by angle is performed as follows: where and are the shearing matrices along the and directions, respectively. System.Xml.XmlElementSystem.Xml.XmlElementSystem.Xml.XmlElement
Step 3. Translation and rotation refinement
Accurate subpixel registration plays a pivotal role in the successful extraction of subsequent polarization information. To ensure consistency with the previous context, we define the 0° polarization as the reference and recover the positional shift and rotation angle by minimizing a cost function as follows: where denotes tracked object region. , and represent the compensated shift in direction, direction, and rotation angle of the tracked object region, respectively. is a transform operation, which can be expressed as
For small values of , we assume and . Therefore, we can obtain the following expression: where and . In the third and fourth lines of the above equation, we adopt the first three terms of the Taylor series expansion as an approximation. With Eq. (A17), the Eq. (A15) can be rewritten as
By differentiating with respect to , and and setting the derivatives equal to zero, we can obtain the to minimize Eq. (15). The estimated registration vector can be expressed as Here, and can be expressed as follows:
The terms and in the above equations can be expressed as
Finally, the registered images can be expressed as