• Journal of Natural Resources
  • Vol. 35, Issue 2, 358 (2020)
Zi-hang FANG1、2, Chun-yang HE1、2、*, Zhi-feng LIU1、2, Yuan-yuan ZHAO3, and Yan-jie YANG1、2
Author Affiliations
  • 1Center for Human-Environment System Sustainability, State Key Laboratory of Earth Surface Processes and Resource Ecology, Beijing Normal University, Beijing 100875, China
  • 2School of Natural Resources, Faculty of Geographical Science, Beijing Normal University, Beijing 100875, China
  • 3School of Soil and Water Conservation, Beijing Forestry University, Beijing 100083, China
  • show less
    DOI: 10.31497/zrzyxb.20200209 Cite this Article
    Zi-hang FANG, Chun-yang HE, Zhi-feng LIU, Yuan-yuan ZHAO, Yan-jie YANG. Climate change and future trends in the Agro-Pastoral Transitional Zone in Northern China: The comprehensive analysis with the historical observation and the model simulation[J]. Journal of Natural Resources, 2020, 35(2): 358 Copy Citation Text show less
    Map showing the study area
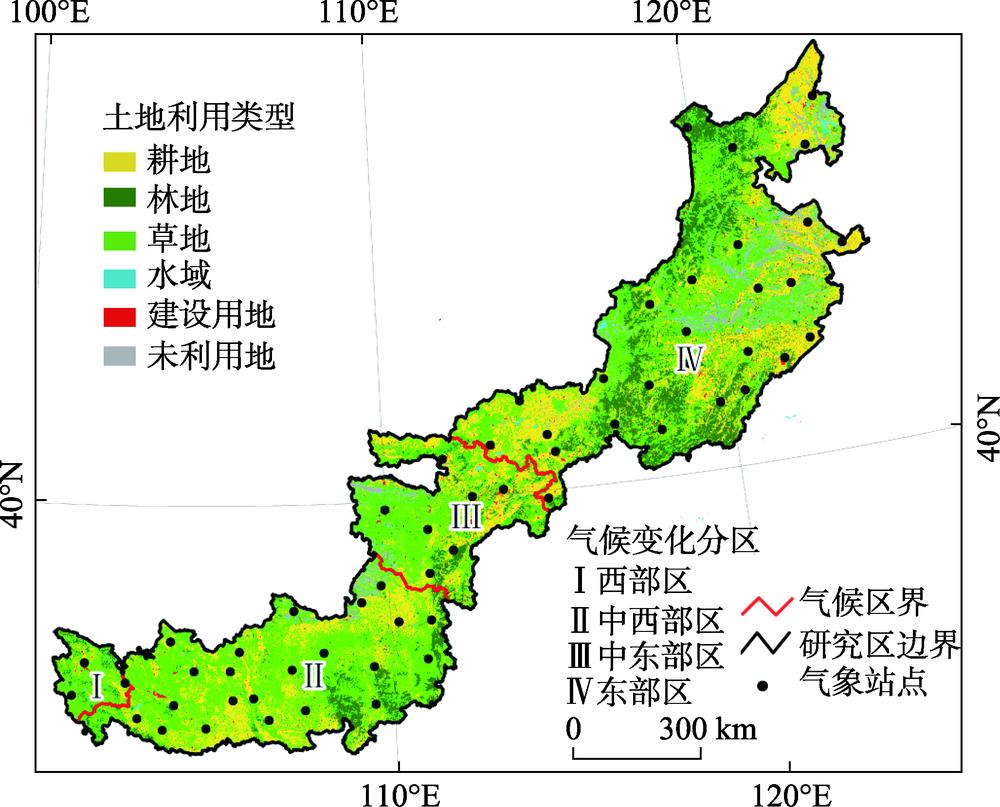
    Fig. 1. Map showing the study area
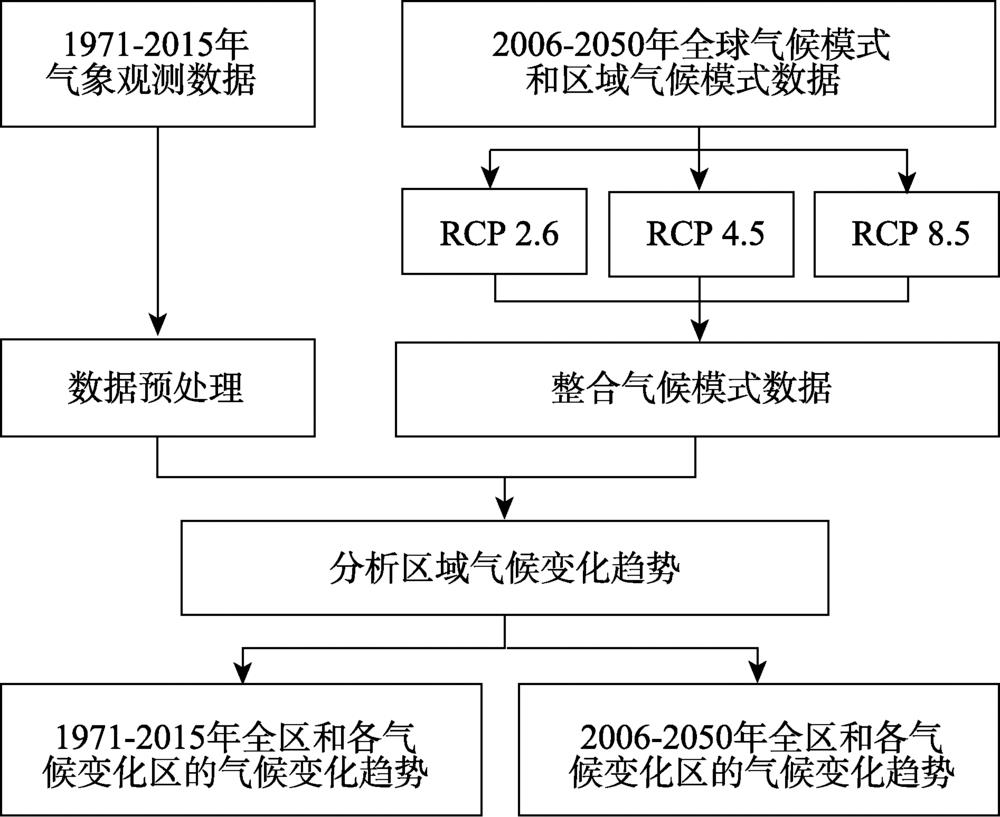
    Flow chart
    Fig. 2. Flow chart
    The regional climate change from 1971 to 2015
    Fig. 3. The regional climate change from 1971 to 2015
    The climate change in each climatic area from 1971 to 2015
    Fig. 4. The climate change in each climatic area from 1971 to 2015
    The change of regional mean annual temperature from 2006 to 2050 under different RCPs
    Fig. 5. The change of regional mean annual temperature from 2006 to 2050 under different RCPs
    The change of regional mean annual precipitation from 2006 to 2050 under different RCPs
    Fig. 6. The change of regional mean annual precipitation from 2006 to 2050 under different RCPs
    The comparison of results from different climate models
    Fig. 7. The comparison of results from different climate models
    The comparison of climate change under different RCPs
    Fig. 8. The comparison of climate change under different RCPs
    模式类型模式名称国家研究机构空间分辨率/(°)参考文献
    全球气候模式BNU中国北京师范大学2.8125×2.8125吴其重等[22]
    CanESM 2加拿大CCCma2.8125×2.8125Chylek等[23]
    CCSM 4美国NCAR0.9375×1.25Peacock[24]
    IPSL-CM5A-LR法国IPSL1.875×3.75Dufresne等[25]
    MPI-ESM-LR德国MPI1.875×1.875Stevens等[26]
    MRI-CGCM3日本MRI1.125×1.125Yukimoto等[27]
    NorESM1-M挪威NCC1.875×2.5Bentsen等[28]
    区域气候模式RegCM 4.0中国国家气候中心1×1Giorgi等[29]
    Table 1. The information about global climate model and regional climate model
    排放情景气候分区变化趋势值
    气温/(℃/10 a)降水/(mm/10 a)
    GCMRCMGCMRCM
    RCP 2.6西部区0.23*0.28*6.70-11.20*
    中西部区0.28*0.20*3.023.58
    中东部区0.32*0.21*5.08-4.27
    东部区0.31*0.20*8.81*2.70
    RCP 4.5西部区0.36*0.26*5.7513.86*
    中西部区0.39*0.33*6.476.82*
    中东部区0.39*0.29*15.44*21.80*
    东部区0.37*0.28*16.12*19.12*
    RCP 8.5西部区0.50*0.52*13.10*21.64*
    中西部区0.49*0.45*18.03*17.36*
    中东部区0.48*0.43*12.10*15.71*
    东部区0.42*0.46*11.35*10.64*
    Table 2. The regional climate change from 2006 to 2050
    模式多年平均气温/℃气温变化速率/(℃/10 a)多年平均降水量/mm降水变化速率/(mm/10 a)
    BNU6.730.36*1143.08-10.35
    CanESM 28.710.47*886.3038.84*
    CCSM 45.910.33*766.649.38*
    IPSL-CM5A-LR3.660.45*705.2715.65*
    MPI-ESM-LR7.960.32*864.82-2.30
    MRI-CGCM 35.160.30*415.9115.03*
    NorESM1-M4.340.40*810.6717.88*
    Table 3. The comparison of seven global climate models
    模式温度降水
    Slope/(℃/10 a)R2Slope/(mm/10 a)R2
    BNU0.430.2012.060.01
    CanESM20.380.24-5.780.002
    CCSM40.200.167.370.03
    IPSL-CM5A-LR0.390.225.320.01
    MPI-ESM-LR0.250.17-16.830.06
    MRI-CGCM30.200.06-12.490.002
    NorESM1-M0.370.414.350.03
    多模式平均值0.320.48-0.860.06
    Table 4. The reliability assessment of global climate models
    Zi-hang FANG, Chun-yang HE, Zhi-feng LIU, Yuan-yuan ZHAO, Yan-jie YANG. Climate change and future trends in the Agro-Pastoral Transitional Zone in Northern China: The comprehensive analysis with the historical observation and the model simulation[J]. Journal of Natural Resources, 2020, 35(2): 358
    Download Citation