Abstract
Coherent beam combining of 60 fiber lasers by using the stochastic parallel gradient descent algorithm has been demonstrated. The functions of pinhole(s) on the power distributions in the far-field have been systematically simulated on both in-phase and out-of-phase modes. Only one photoelectric detector was used to detect the combined power in the far-field central lobe of the in-phase mode state. When the phase controller was in a closed loop, the contrast of the far-field intensity pattern was as high as ~97% with residual phase error of /30, and ~34.7% of the total power was contained in the central lobe.Fiber lasers can be widely used for their advantages such as excellent beam quality, high conversion efficiency, and high stability[1,2]. Owing to the nonlinear effects, mode instability, and so on, the output power from the single fiber is limited[3–5]. Coherent beam combining (CBC) provides a promising way to obtain higher output power while maintaining good beam quality[6–13]. Especially, CBC of a distributed aperture array has tremendous advantages in weight, size, and heat management of laser system as well as mitigating wave-front aberration[14,15]. Based on a master oscillator power amplifier (MOPA) configuration, many active phase-locking approaches have been proposed. In general, those approaches can be categorized into direct measurement methods and indirect measurement methods. The criterion of classification is whether the method obtains the phase information of each channel directly by additional optical devices or optical methods.
In direct measurement methods, phase errors between channels are, respectively, measured, and then corresponding corrections are implemented. High control bandwidth can be obtained by direct phase measurement. However, complex phase detection systems are usually employed, such as photoelectric detector (PD) arrays or high-speed cameras for measuring phase errors[16,17], synchronization control of hybrid structure[18], and micro-lens arrays for transforming complex amplitude to phase-related intensity[19,20]. In terms of combining channels, dozens of fiber laser phases have been effectively locked by using direct measurement methods, such as interferometric measurement[16,21,22], heterodyne detection[17], and phase intensity mapping[19,20]. It is worth noting that the CBC of 60 fs fiber amplifiers by utilizing the interferometric measurement method has been demonstrated[21].
As for indirect detection techniques, only one PD is used, and the power of the central lobe in the far-field is maximized by optimization algorithms such as the stochastic parallel gradient descent (SPGD) algorithm[23], multi-dithering[24–26], single-frequency dithering[27], and multilevel phase dithering[28]. Some new optimization algorithms such as reinforced learning and deep learning have also been used in the CBC system recently[29,30], but only achieve phase-locking of fiber arrays with a few channels for now. The ability of expending the scale of CBC by deep learning has been proved in a recent research[31]. The structure of the indirect measurement method is relatively simple; nonetheless, control bandwidth decreases with increasing laser channels. In multi-dithering and single-frequency dithering techniques, the control bandwidths are limited by the modulating frequency and modulating period of each channel, respectively. Therefore, the cascaded phase control was proposed to solve this problem at the expense of system complexity, and this technique can achieve massive-scale coherent beam combination[32,33]. By using the cascaded phase control technique, 16 fiber lasers have been coherently combined[33,34]. In order to implement the CBC of dozens of fiber laser channels by indirect measurement methods, both the hardware and software of phase controllers should be optimized.
Sign up for Chinese Optics Letters TOC. Get the latest issue of Chinese Optics Letters delivered right to you!Sign up now
In this Letter, we demonstrate the effective phase control ability of the indirect detection technique at a CBC system with 60 fiber lasers by using the SPGD algorithm. This optimal algorithm is relatively proven and has been utilized in CBC and compensation of atmosphere turbulence for quite a long time[8,23,35]. Based on keeping better performance of phase-locking, the system keeps the simplified structure as much as possible.
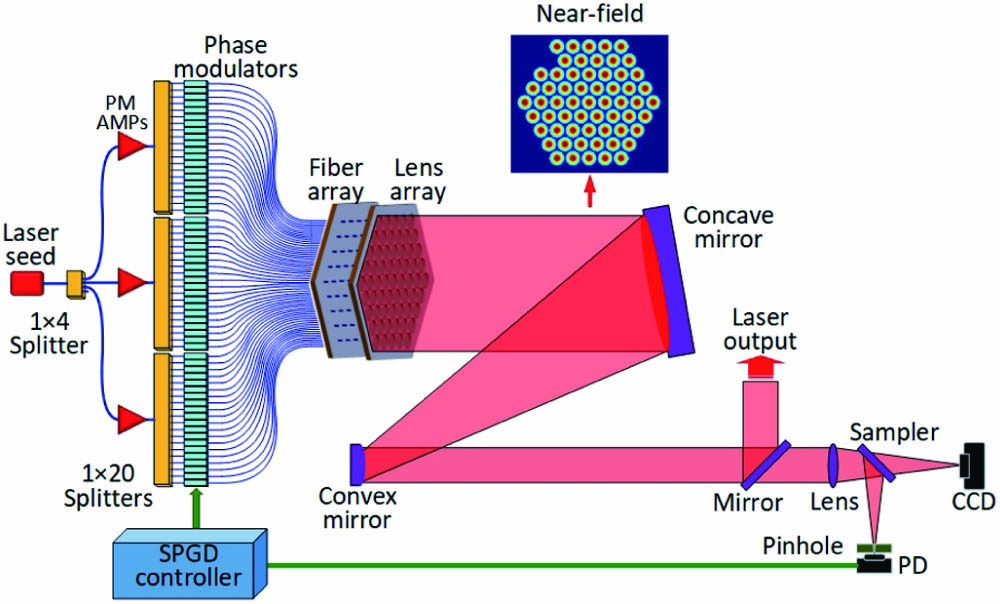
The experimental setup for the 60-channel active phase-locking CBC system is shown in Fig. 1. A single-frequency continuous wave 1064 nm seed laser with an output power of ∼50 mW was divided into four channels by a splitter. Only three outputs were used in experiment. Then, three outputs were amplified to ∼1 W separately by polarization maintaining fiber amplifiers (PM AMPs). Each of the three outputs was further split into 20 channels, and 60 phase modulators with more than 100 MHz modulating bandwidth were then inserted into each laser channel for phase control.

Figure 1.Experimental setup of the 60-channel active phase-locking CBC system. PM AMPs, polarization maintaining fiber amplifiers; PD, photoelectric detector.
To obtain beam array with high fill factor, a beam combiner was designed. In the beam combiner, 60 output fibers were tiled into a hexagonal array and followed by a lens array. This beam combiner can also be expanded to realize CBC of a larger number of fiber lasers. The diameter of each collimating lens was 23 mm, and the distance between the centers of two adjacent lenses was 25 mm. The designed fill factor of the lens array was 92%. Based on the technique of flexible hinges, the homemade collimators had the ability to adjust tilt and collimation of output beams manually[36]. A lateral-shearing interferometer was used to evaluate whether each beam was collimated. At the same time, we adjusted the tilt and collimation of each laser carefully to let every laser spot focus on the same position in the far-field.
The inset of Fig. 1 is the near-field intensity pattern. The element number of the combiner was 61. Due to the limited number of fiber lasers, there were only 60 beams in our experiment. The collimated laser array from the lens array was compressed by the combination of a concave mirror and a convex mirror. Most of the power of the laser array was reflected by a mirror, and the rest of the beam was focused by a lens and divided into two beams by a sampler. One beam was focused on a CCD to observe the far-field interference pattern, while the other was intercepted by a pinhole and then detected by a PD.
In our experiment, the calculated radius of the Airy disc of the combined beam in the far-field was ∼174 μm. We simulated the influence of the radius of a single pinhole on the power in the bucket (PIB) by using the SPGD algorithm, as shown in Fig. 2(a). The PIB starts to decrease, and the far-field pattern will change when the radius of the pinhole is larger than the radius of the Airy disc. A typical simulated result of the far-field intensity pattern after CBC using the SPGD algorithm is shown in Fig. 2(b), where the radius of the pinhole is 280 μm. When the radius of the pinhole is smaller than the radius of the Airy disc, the PIB maintains at a high level and shows little difference varying with the radius of the pinhole, and a typical simulated result of the far-field intensity pattern after CBC using the SPGD algorithm is shown in Fig. 2(c). However, if the radius of the pinhole is too small in the experiment, the power in the pinhole will be too weak and cannot provide enough signal strength.
Figure 2.Simulation results. (a) Influence of the pinhole radius on the PIB. (b) A typical far-field intensity pattern when the radius of the pinhole is larger than the radius of the Airy disc after CBC using the SPGD algorithm. (c) A typical far-field intensity pattern when the radius of the pinhole is smaller than the radius of the Airy disc after CBC using the SPGD algorithm.
It is notable that an out-of-phase mode in Fig. 2(b) can be obtained by using the SPGD algorithm, which indicates that beam shaping in the spatial domain could be realized by CBC[37,38]. In laser machining, different shapes of beam profiles are required in different application scenarios[39], and a hollow beam can be used to trap and guide cold atoms [40]. The simulations of beam shaping by CBC were carried out in the following section. However, using a single large pinhole to obtain cost function is not always effective to shape this pattern in simulation. To restrict the central lobe of the far-field pattern in a ring-shaped area, the equivalent shape of the filter can be a ring. It is an available way to get a ring-shaped filter by using the combination of two pinholes. The far-field pattern can be intercepted by filter 1 and filter 2 at the same time to get sub-cost-functions and by PD 1 and PD 2, respectively. The shapes of filter 1 and filter 2 are shown in Figs. 3(a) and 3(b), where represents the diameter of the pinhole in filter 1, and represents the diameter of the pinhole in filter 2. Then, the cost function is defined as . The equivalent ring-shaped filter is shown in Fig. 3(c). In simulation, proper and were selected to shape the annular intensity pattern, as shown in Fig. 3(d), where , , and presents the radius of the Airy disc. The corresponding feedback signal acquisition diagram is shown in Fig. 4.
Figure 3.(a) Shape of filter 1. (b) Shape of filter 2. (c) Equivalent filter. (d) An out-of-phase mode obtained in simulation within 2000 iterations.
Figure 4.Acquisition diagram of a ring-shaped out-of-phase mode.
Other out-of-phase modes can be obtained using the same strategy. Considering different topological properties of different out-of-phase modes, an additional filter is needed to balance the distribution of energy in the far-field. Filters and simulation results of other out-of-phase modes are shown in Fig. 5. Three PDs are needed in shaping these two out-of-phase modes. Sub-cost-function can be obtained by filter and PD , where , 2, or 3. Then, cost function is defined as where presents the maximum energy in a given area, denotes the minimum energy in the central band area, and denotes the minimum difference of two lobes. The reduced formula is defined as
Figure 5.Filters and simulation results of other out-of-phase modes within 1000 iterations.
However, limited by bandwidth of the SPGD algorithm, Eq. (2) may not be suitable for more complex out-of-phase modes. Further, if a high-speed camera is used to replace the filters and PDs to obtain cost function, dynamic beam shaping can also be theoretically expected, because the cost function can be changed in a timely manner by processing the digital image from the camera.
In this experiment, we aimed at obtaining an in-phase mode. A single circular pinhole with the radius of 50 μm was adopted in this experiment to obtain the cost function . We used a three-dimensional (3D) precision adjusting device to move the pinhole into the center of central lobe of the interference pattern in the far-field.
A photograph of the SPGD controller is given in Fig. 6(a), and the rear panel of the SPGD controller is shown in Fig. 6(b). The homemade phase controller was based on a field programmable gate array (FPGA). A digital-to-analog converter (DAC) with 100 MSPS (million samples per second) update rate was employed to generate driving signals. The driving signals were then amplified to by broadband power amplifiers and further applied to phase modulators. The range of driving signals covering the phase of for the half-wave voltage of phase modulators was ∼2 V. An analog-to-digital converter (ADC) with a maximum sampling frequency of 75 MHz was adopted to sample the output signal of the PD. The input range of the ADC was 0–2 V, and sampling precision was ∼2 mV. A low-pass filter (LPF) was designed and inserted before the ADC to remove sampling electrical noise, and a voltage amplifier was inserted before the LPF to enlarge the weak signal or avoid saturation. The input voltage of the ADC can be adjusted by a knob in the front panel; at the same time, the input voltage level was displayed at the touch screen to guarantee the input signal in the appropriate range. The interfaces of the ADC and DAC were parallel to enhance transfer speed of data. To maintain the integrity of the signals, the clocks of both ADC and DAC were set at 50 MHz in our experiment.
Figure 6.(a) Photograph of the SPGD controller. (b) Rear panel of the SPGD controller.
The power in the central lobe was converted to an electrical signal by single PD firstly. Then, the ADC received the electrical signal from the PD and sent it to the phase controller. After processing the input signal, the control circuit generated control signals and output them after being amplified through 60 DAC modules to maximize the power in the central lobe. With the main clock of 50 MHz, the control circuit can implement the SPGD algorithm with an iteration rate of . By using a touch screen, the parameters of the SPGD algorithm can be adjusted online. To obtain faster gradient descent and reduce calculation properly, the SPGD algorithm used in this Letter was bidirectionally disturbed, and the direction and step size of gradient renewal obeyed Bernoulli distribution.
Figure 7 shows the normalized output electrical signal of the PD, which is used as cost function for the SPGD algorithm. At first, the phase controller was turned off. The phase of each channel was randomly distributed, so the coherently combined beam intensity remained at a low level and varied, and the intensity pattern observed by the CCD was blurred and kept shifting. When the phase controller was turn on, the SPGD algorithm was implemented to maximize the cost function. The power of the central lobe increased abruptly. Through calculations and comparison, the normalized cost function was more than 0.9 in the closed loop, and there was a ∼38 times enhancement compared with that in the open loop. Evaluated by root mean square phase residual, the residual phase error was .
Figure 7.Normalized cost function in 40 s long exposure of open and closed loops.
The 40 s long exposure far-field intensity pattern is shown in Fig. 8(a), and the corresponding theoretical far-field intensity pattern is shown in Fig. 8(b). There was a central lobe with higher power and six weak surrounding side lobes. The fraction of the laser power within a solid angle of was ∼34.7%. The far-field intensity profiles of the cross section are shown in Fig. 8(c). The position of the cross section was indicated by a white line. The red line in Fig. 8(c) shows the theoretical intensity profile in the far-field of 60 beams with a tiled hexagonal arrangement and ideal phases at the emission surface. The blue one represents experimental results. The two curves are close, while there are still some deviations. For the existence of phase residual, tilt errors, and collimating errors, the experimental power of side lobes was higher than the theoretical one.
Figure 8.(a) Long-exposure far-field pattern of the 60 lasers in closed loop. (b) Theoretical far-field pattern of the beam array with ideal phases at the emission surface. (c) Experimental (in blue) and theoretical (in red) intensity profiles of a cross section in the far-field.
In addition, we calculated the fringe contrast to evaluate combining performance. The fringe contrast of the long-exposure far-field intensity pattern was ∼97%. The fringe contrast is defined by , where and are the maximum optical intensity and the adjacent minimum optical intensity in the intensity pattern.
In summary, a CBC experimental setup for 60 fiber lasers was built. A homemade phase controller based on FPGA was made, and the iteration rate of the SPGD algorithm was . Phase-locking of the 60 fiber lasers was realized. The contrast of the far-field intensity pattern of the combined beam was ∼97%, and ∼34.7% of the total emitted power was contained in the central lobe within a solid angle of . With the residual phase error , the power of central lobe was in the closed loop was ∼38 times that in the open loop. The system has the ability of scaling to a much larger number of fibers. Further developments will involve improving the optimization algorithm, and a higher speed phase controller for a larger number of active fibers phase controlled by the indirect detection technique.
References
[1] C. Jauregui, J. Limpert, A. Tünnermann. Nat. Photon., 7, 861(2013).
[2] M. Zervas, C. Codemard. IEEE J. Sel. Top. Quantum Electron., 20, 219(2014).
[3] J. W. Dawson, M. J. Messerly, R. J. Beach, M. Y. Shverdin, E. A. Stappaerts, A. K. Sridharan, P. H. Pax, J. E. Heebner, C. W. Siders, C. P. J. Barty. Opt. Express, 16, 13240(2008).
[4] H.-J. Otto, C. Jauregui, J. Limpert, A. Tünnermann(2016).
[5] J. Zhu, P. Zhou, Y. Ma, X. Xu, Z. Liu. Opt. Express, 19, 18645(2011).
[6] A. Klenke, S. Breitkopf, M. Kienel, T. Gottschall, T. Eidam, S. Hädrich, J. Rothhardt, J. Limpert, A. Tünnermann. Opt. Lett., 38, 2283(2013).
[7] M. Fridman, M. Nixon, N. Davidson, A. A. Friesem. Opt. Lett., 35, 1434(2010).
[8] M. A. Vorontsov, G. W. Carhart, J. C. Ricklin. Opt. Lett., 22, 907(1997).
[9] T. Y. Fan. IEEE J. Sel. Top. Quantum Electron., 11, 567(2005).
[10] M. Hanna, D. Papadopoulos, L. Daniault, F. Druon, P. Georges, Y. Zaouter. Coherent Laser Beam Combining(2013).
[11] Z. Liu, P. Ma, R. Su, R. Tao, Y. Ma, X. Wang, P. Zhou. J. Opt. Soc. Am. B, 34, A7(2017).
[12] M. Müller, C. Aleshire, A. Klenke, E. Haddad, F. Légaré, A. Tünnermann, J. Limpert. Opt. Lett., 45, 3083(2020).
[13] B. Midya, H. Zhao, X. Qiao, P. Miao, W. Walasik, Z. Zhang, N. M. Litchinitser, L. Feng. Photon. Res., 7, 363(2019).
[14] C. Geng, F. Li, J. Zuo, J. Liu, X. Yang, T. Yu, J. Jiang, X. Li. Opt. Lett., 45, 1906(2020).
[15] M. A. Vorontsov, Tu2A.1(2016).
[16] J. Bourderionnet, C. Bellanger, J. Primot, A. Brignon. Opt. Express, 19, 17053(2011).
[17] C. X. Yu, J. E. Kansky, S. E. J. Shaw, D. V. Murphy, C. Higgs. Electron. Lett., 42, 1024(2006).
[18] C. Peng, X. Liang, R. Liu, W. Li, R. Li. Opt. Lett., 42, 3960(2017).
[19] D. Kabeya, V. Kermene, M. Fabert, J. Benoist, A. Desfarges-Berthelemot, A. Barthelemy. Opt. Express, 23, 31059(2015).
[20] D. Kabeya, V. Kermène, M. Fabert, J. Benoist, J. Saucourt, A. Desfarges-Berthelemot, A. Barthélémy. Opt. Express, 25, 13816(2017).
[21] I. Fsaifes, L. Daniault, S. Bellanger, M. Veinhard, J. Bourderionnet, C. Larat, E. Lallier, E. Durand, A. Brignon, J.-C. Chanteloup. Proc. SPIE, 11260, 112600L(2020).
[22] A. Heilmann, J. E. R. E. Le Dortz, L. Daniault, I. Fsaifes, S. E. V. Bellanger, J. E. R. O. Bourderionnet, C. Larat, E. Lallier, M. Antier, E. Durand, C. Simon-Boisson, A. Brignon, J.-C. Chanteloup. Opt. Express, 26, 31542(2018).
[23] R. Su, P. Zhou, X. Wang, H. Zhang, X. Xu. Opt. Lett., 37, 3978(2012).
[24] P. A. Thielen, J. G. Ho, D. A. Burchman, G. D. Goodno, J. E. Rothenberg, M. G. Wickham, A. Flores, C. A. Lu, B. Pulford, C. Robin, A. D. Sanchez, D. Hult, K. B. Rowland. Opt. Lett., 37, 3741(2012).
[25] T. M. Shay, V. Benham, J. T. Baker, A. D. Sanchez, D. Pilkington, C. A. Lu. IEEE J. Sel. Top. Quantum Electron., 13, 480(2007).
[26] H. Stark, J. Buldt, M. Müller, A. Klenke, A. Tünnermann, J. Limpert. Opt. Lett., 44, 5529(2019).
[27] Y. Ma, X. Wang, J. Leng, H. Xiao, X. Dong, J. Zhu, W. Du, P. Zhou, X. Xu, L. Si, Z. Liu, Y. Zhao. Opt. Lett., 36, 951(2011).
[28] Z. Huang, X. Tang, Y. Luo, C. Liu, J. Li, D. Zhang, X. Wang, T. Chen, M. Han. Rev. Sci. Instrum., 87, 033109(2016).
[29] H. Tünnermann, A. Shirakawa. Opt. Express, 27, 24223(2019).
[30] R. Liu, C. Peng, X. Liang, R. Li. Chin. Opt. Lett., 18, 41402(2020).
[31] T. Hou, Y. An, Q. Chang, P. Ma, J. Li, D. Zhi, L. Huang, R. Su, J. Wu, Y. Ma. High Power Laser Sci. Eng., 7, e59(2019).
[32] H. K. Ahn, H. J. Kong. Appl. Opt., 55, 4101(2016).
[33] R. Su, Z. Zhang, P. Zhou, Y. Ma, X. Wang, X. Xu. IEEE Photon. Technol. Lett., 28, 2585(2016).
[34] H. K. Ahn, H. J. Kong. Opt. Express, 23, 12407(2015).
[35] M. Li, X. Liu, A. Zhang, H. Xian. Chin. Opt. Lett., 17, 061101(2019).
[36] D. Zhi, P. Ma, Y. Ma, X. Wang, P. Zhou, L. Si. Opt. Express, 22, 31520(2014).
[37] T. Hou, Y. An, Q. Chang, P. Ma, J. Li, L. Huang, D. Zhi, J. Wu, R. Su, Y. Ma, P. Zhou. Photon. Res., 8, 715(2020).
[38] D. Zhi, T. Hou, P. Ma, Y. Ma, P. Zhou, R. Tao, X. Wang, L. Si. High Power Laser Sci. Eng., 7, 33(2019).
[39] R. El-Agmy, H. Bulte, A. H. Greenaway, D. T. Reid. Opt. Express, 13, 6085(2005).
[40] J. Yin, W. Gao, Y. Zhu. Prog. Opt., 45, 119(2003).