• Chinese Optics Letters
  • Vol. 15, Issue 7, 071901 (2017)
Guicun Li1、2, Yinghui Zheng1、*, Zhinan Zeng1、**, and Ruxin Li1
Author Affiliations
  • 1Shanghai Institute of Optics and Fine Mechanics, Chinese Academy of Sciences, Shanghai 201800, China
  • 2University of Chinese Academy of Sciences, Beijing 100049, China
  • show less
    DOI: 10.3788/COL201715.071901 Cite this Article Set citation alerts
    Guicun Li, Yinghui Zheng, Zhinan Zeng, Ruxin Li. Intense keV IAP generation by orthogonally polarized multicycle midinfrared two-color laser fields[J]. Chinese Optics Letters, 2017, 15(7): 071901 Copy Citation Text show less
    (a) Harmonic spectrum obtained by the MIR 800/400 nm OTC field in the He atom. (b) The time frequency analysis of (a). (c) and (d) The same as (a) and (b), respectively, but for the MIR 1800/900 nm OTC field. In both cases the laser intensities are Iω=6×10¹⁴ W/cm2, (1800 or 800 nm), and I2ω=1.2×10¹⁵ W/cm2, (900 or 400 nm), the two-color delay is fixed at zero, and the fundamental and SH pulses have the same duration of 8 T. Note that diagrams (b) and (d) are plotted on the logarithmic scale.
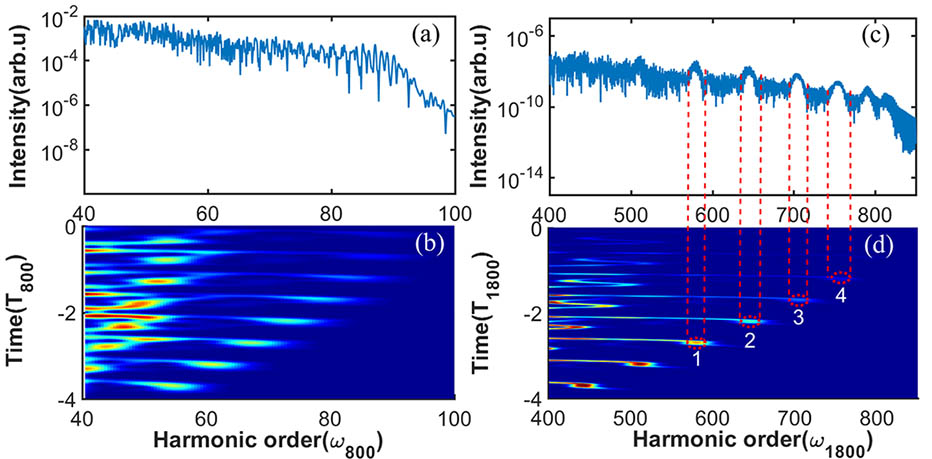
    Fig. 1. (a) Harmonic spectrum obtained by the MIR 800/400 nm OTC field in the He atom. (b) The time frequency analysis of (a). (c) and (d) The same as (a) and (b), respectively, but for the MIR 1800/900 nm OTC field. In both cases the laser intensities are Iω=6×10¹⁴W/cm2, (1800 or 800 nm), and I2ω=1.2×10¹⁵W/cm2, (900 or 400 nm), the two-color delay is fixed at zero, and the fundamental and SH pulses have the same duration of 8 T. Note that diagrams (b) and (d) are plotted on the logarithmic scale.
    (Color online) (a) Radial distance from the origin of the coordinate system as a function of the time after the electron is freed by the 1800/900 nm MIR-OTC field at −3.4951 T (blue line), −3.4870 T (red line), and −3.4801 T (green line), respectively. (b) The photon energy of the emitting high harmonics, corresponding to (a) as a function of different instants after ionization. (c) and (d) Enlarged diagrams of (a) and (b) in the time range from −2.9 to –2.5 T, respectively. The solid black line in (c) indicates that only the electron within 10 a.u. from the ionic core can emit strong high harmonics for a specific spectral range, as denoted by the arrows in (d). Laser parameters are the same as those in Figs. 1(c) and 1(d).
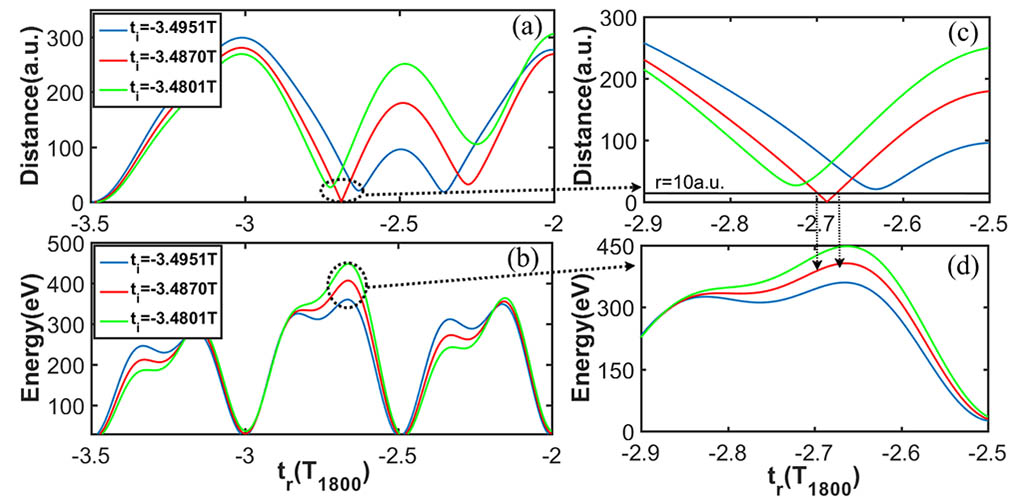
    Fig. 2. (Color online) (a) Radial distance from the origin of the coordinate system as a function of the time after the electron is freed by the 1800/900 nm MIR-OTC field at 3.4951T (blue line), 3.4870T (red line), and 3.4801T (green line), respectively. (b) The photon energy of the emitting high harmonics, corresponding to (a) as a function of different instants after ionization. (c) and (d) Enlarged diagrams of (a) and (b) in the time range from 2.9to2.5T, respectively. The solid black line in (c) indicates that only the electron within 10 a.u. from the ionic core can emit strong high harmonics for a specific spectral range, as denoted by the arrows in (d). Laser parameters are the same as those in Figs. 1(c) and 1(d).
    (Color online) Time profiles of generated sub-cycle pulses by superposing the harmonics (a) from the 65th to the 75th order in the 800/400 nm OTC field and (b) from the corresponding spectral humps in the 1800/900 nm OTC field, respectively.
    Fig. 3. (Color online) Time profiles of generated sub-cycle pulses by superposing the harmonics (a) from the 65th to the 75th order in the 800/400 nm OTC field and (b) from the corresponding spectral humps in the 1800/900 nm OTC field, respectively.
    (Color online) Harmonic spectra obtained by the single-color (blue line), PTC (black line), and OTC (red line) fields, respectively. In PTC and OTC schemes, simulation parameters are the same as those in Figs. 1(c) and 1(d). For the single-color 1800 nm field, the laser intensity is the sum of two-color schemes, 1.8×10¹⁵ W/cm2. The inset shows the time profiles by superposing 570th–590th harmonics (corresponding to the first hump in OTC field) generated by the three schemes.
    Fig. 4. (Color online) Harmonic spectra obtained by the single-color (blue line), PTC (black line), and OTC (red line) fields, respectively. In PTC and OTC schemes, simulation parameters are the same as those in Figs. 1(c) and 1(d). For the single-color 1800 nm field, the laser intensity is the sum of two-color schemes, 1.8×10¹⁵W/cm2. The inset shows the time profiles by superposing 570th–590th harmonics (corresponding to the first hump in OTC field) generated by the three schemes.
    High-harmonic spectrum in the 4000/2000 nm OTC field. Humps with different central photon energies are denoted by red ellipses. Other simulation parameters are the same as those in Fig. 1. The inset shows the time profile by superposing 5993rd–6033rd harmonics.
    Fig. 5. High-harmonic spectrum in the 4000/2000 nm OTC field. Humps with different central photon energies are denoted by red ellipses. Other simulation parameters are the same as those in Fig. 1. The inset shows the time profile by superposing 5993rd–6033rd harmonics.
    Guicun Li, Yinghui Zheng, Zhinan Zeng, Ruxin Li. Intense keV IAP generation by orthogonally polarized multicycle midinfrared two-color laser fields[J]. Chinese Optics Letters, 2017, 15(7): 071901
    Download Citation