• Chinese Optics Letters
  • Vol. 21, Issue 9, 093801 (2023)
Shufa Hao1、2、3, Zhengxing Lv1、3, Hao Dong1、2、3, Jianzhi He1、2、3, Nanshun Huang3、4, Fengyu Sun1、2、3, Zhiyong Shi1, Hao Sun3、4, Wenpeng Wang1、3、*, Yuxin Leng1、3, Ruxin Li1、2、3, and Zhizhan Xu1、**
Author Affiliations
  • 1State Key Laboratory of High Field Laser Physics and CAS Center for Excellence in Ultra-intense Laser Science, Shanghai Institute of Optics and Fine Mechanics, Chinese Academy of Sciences, Shanghai 201800, China
  • 2School of Physical Science and Technology, ShanghaiTech University, Shanghai 201210, China
  • 3University of Chinese Academy of Sciences, Beijing 100049, China
  • 4Shanghai Institute of Applied Physics, Chinese Academy of Sciences, Shanghai 201800, China
  • show less
    DOI: 10.3788/COL202321.093801 Cite this Article Set citation alerts
    Shufa Hao, Zhengxing Lv, Hao Dong, Jianzhi He, Nanshun Huang, Fengyu Sun, Zhiyong Shi, Hao Sun, Wenpeng Wang, Yuxin Leng, Ruxin Li, Zhizhan Xu. High-gradient modulation of microbunchings using a minimized system driven by a vortex laser[J]. Chinese Optics Letters, 2023, 21(9): 093801 Copy Citation Text show less
    (a) Schematic layout of the microbunching scheme and its potential application. (b), (c) Electric field (Ey) of LG and Gaussian laser. The corresponding vector plot of the electric fields for (d1)–(d4) LG01 (σ = −1) and (e1)–(e4) Gaussian laser.
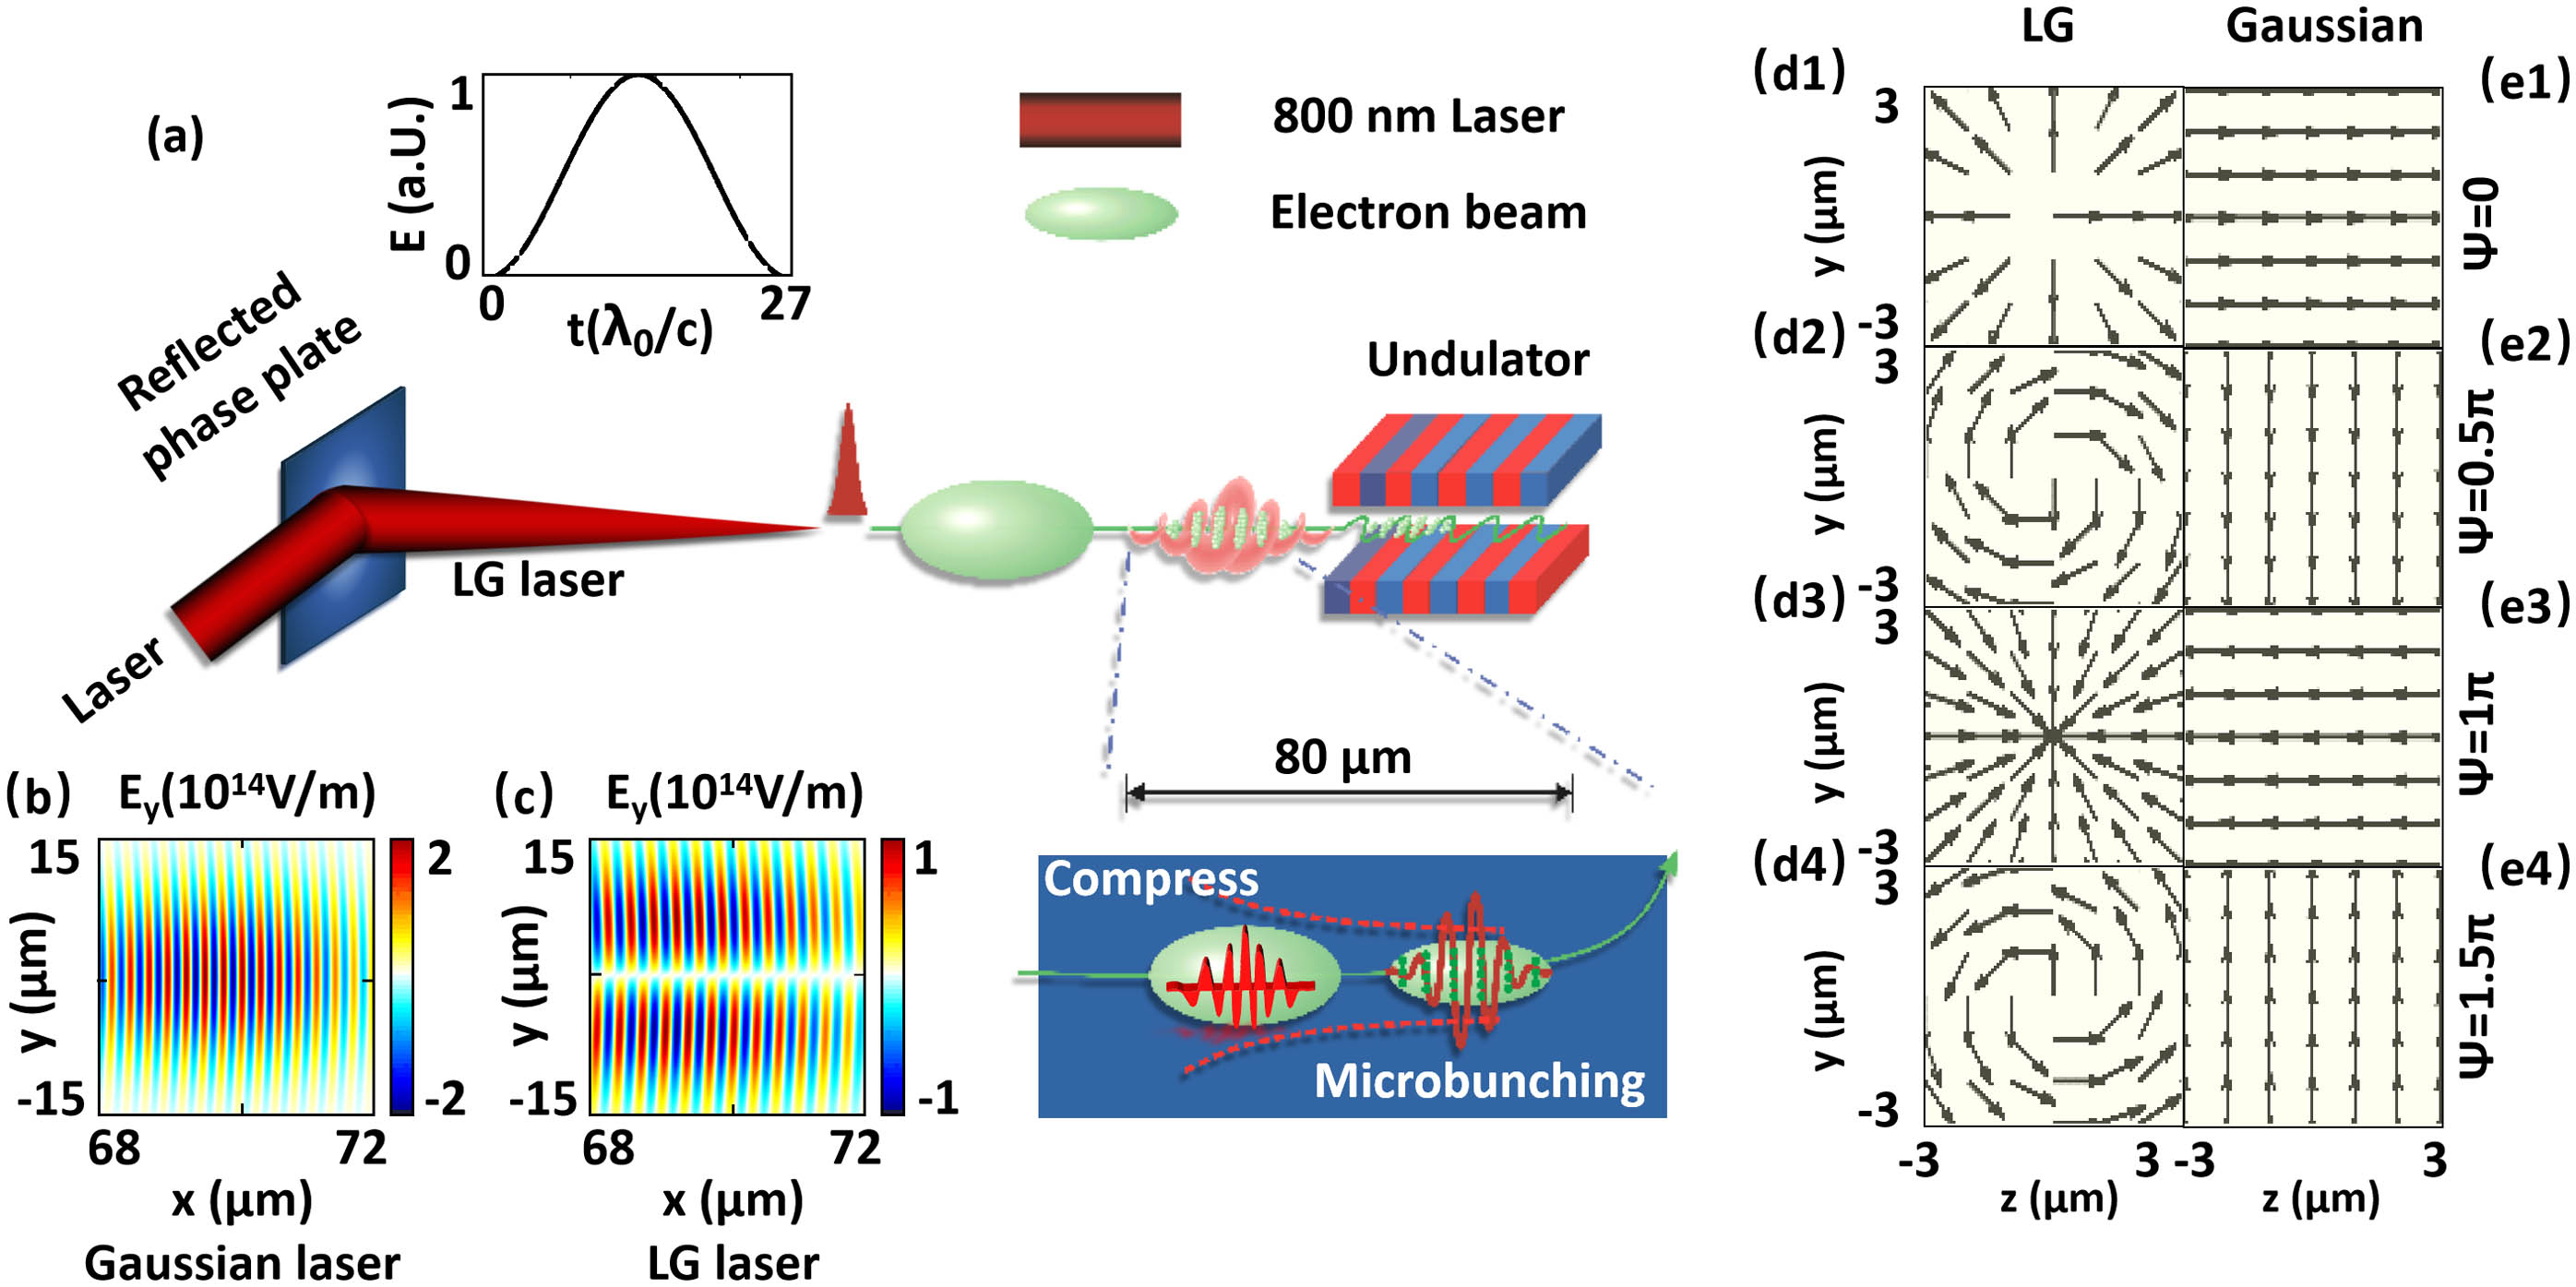
    Fig. 1. (a) Schematic layout of the microbunching scheme and its potential application. (b), (c) Electric field (Ey) of LG and Gaussian laser. The corresponding vector plot of the electric fields for (d1)–(d4) LG01 (σ = −1) and (e1)–(e4) Gaussian laser.
    (a), (b) Electron density maps generated by the LG laser at 20T and 100T. (e), (f) Electron density maps generated by the Gaussian laser under the same initial conditions as the LG laser. (c), (g) Longitudinal phase space distributions of electrons in (b) and (f). (d), (h) Comparison of the energy spectrum distribution and electron divergence generated by the LG and Gaussian lasers.
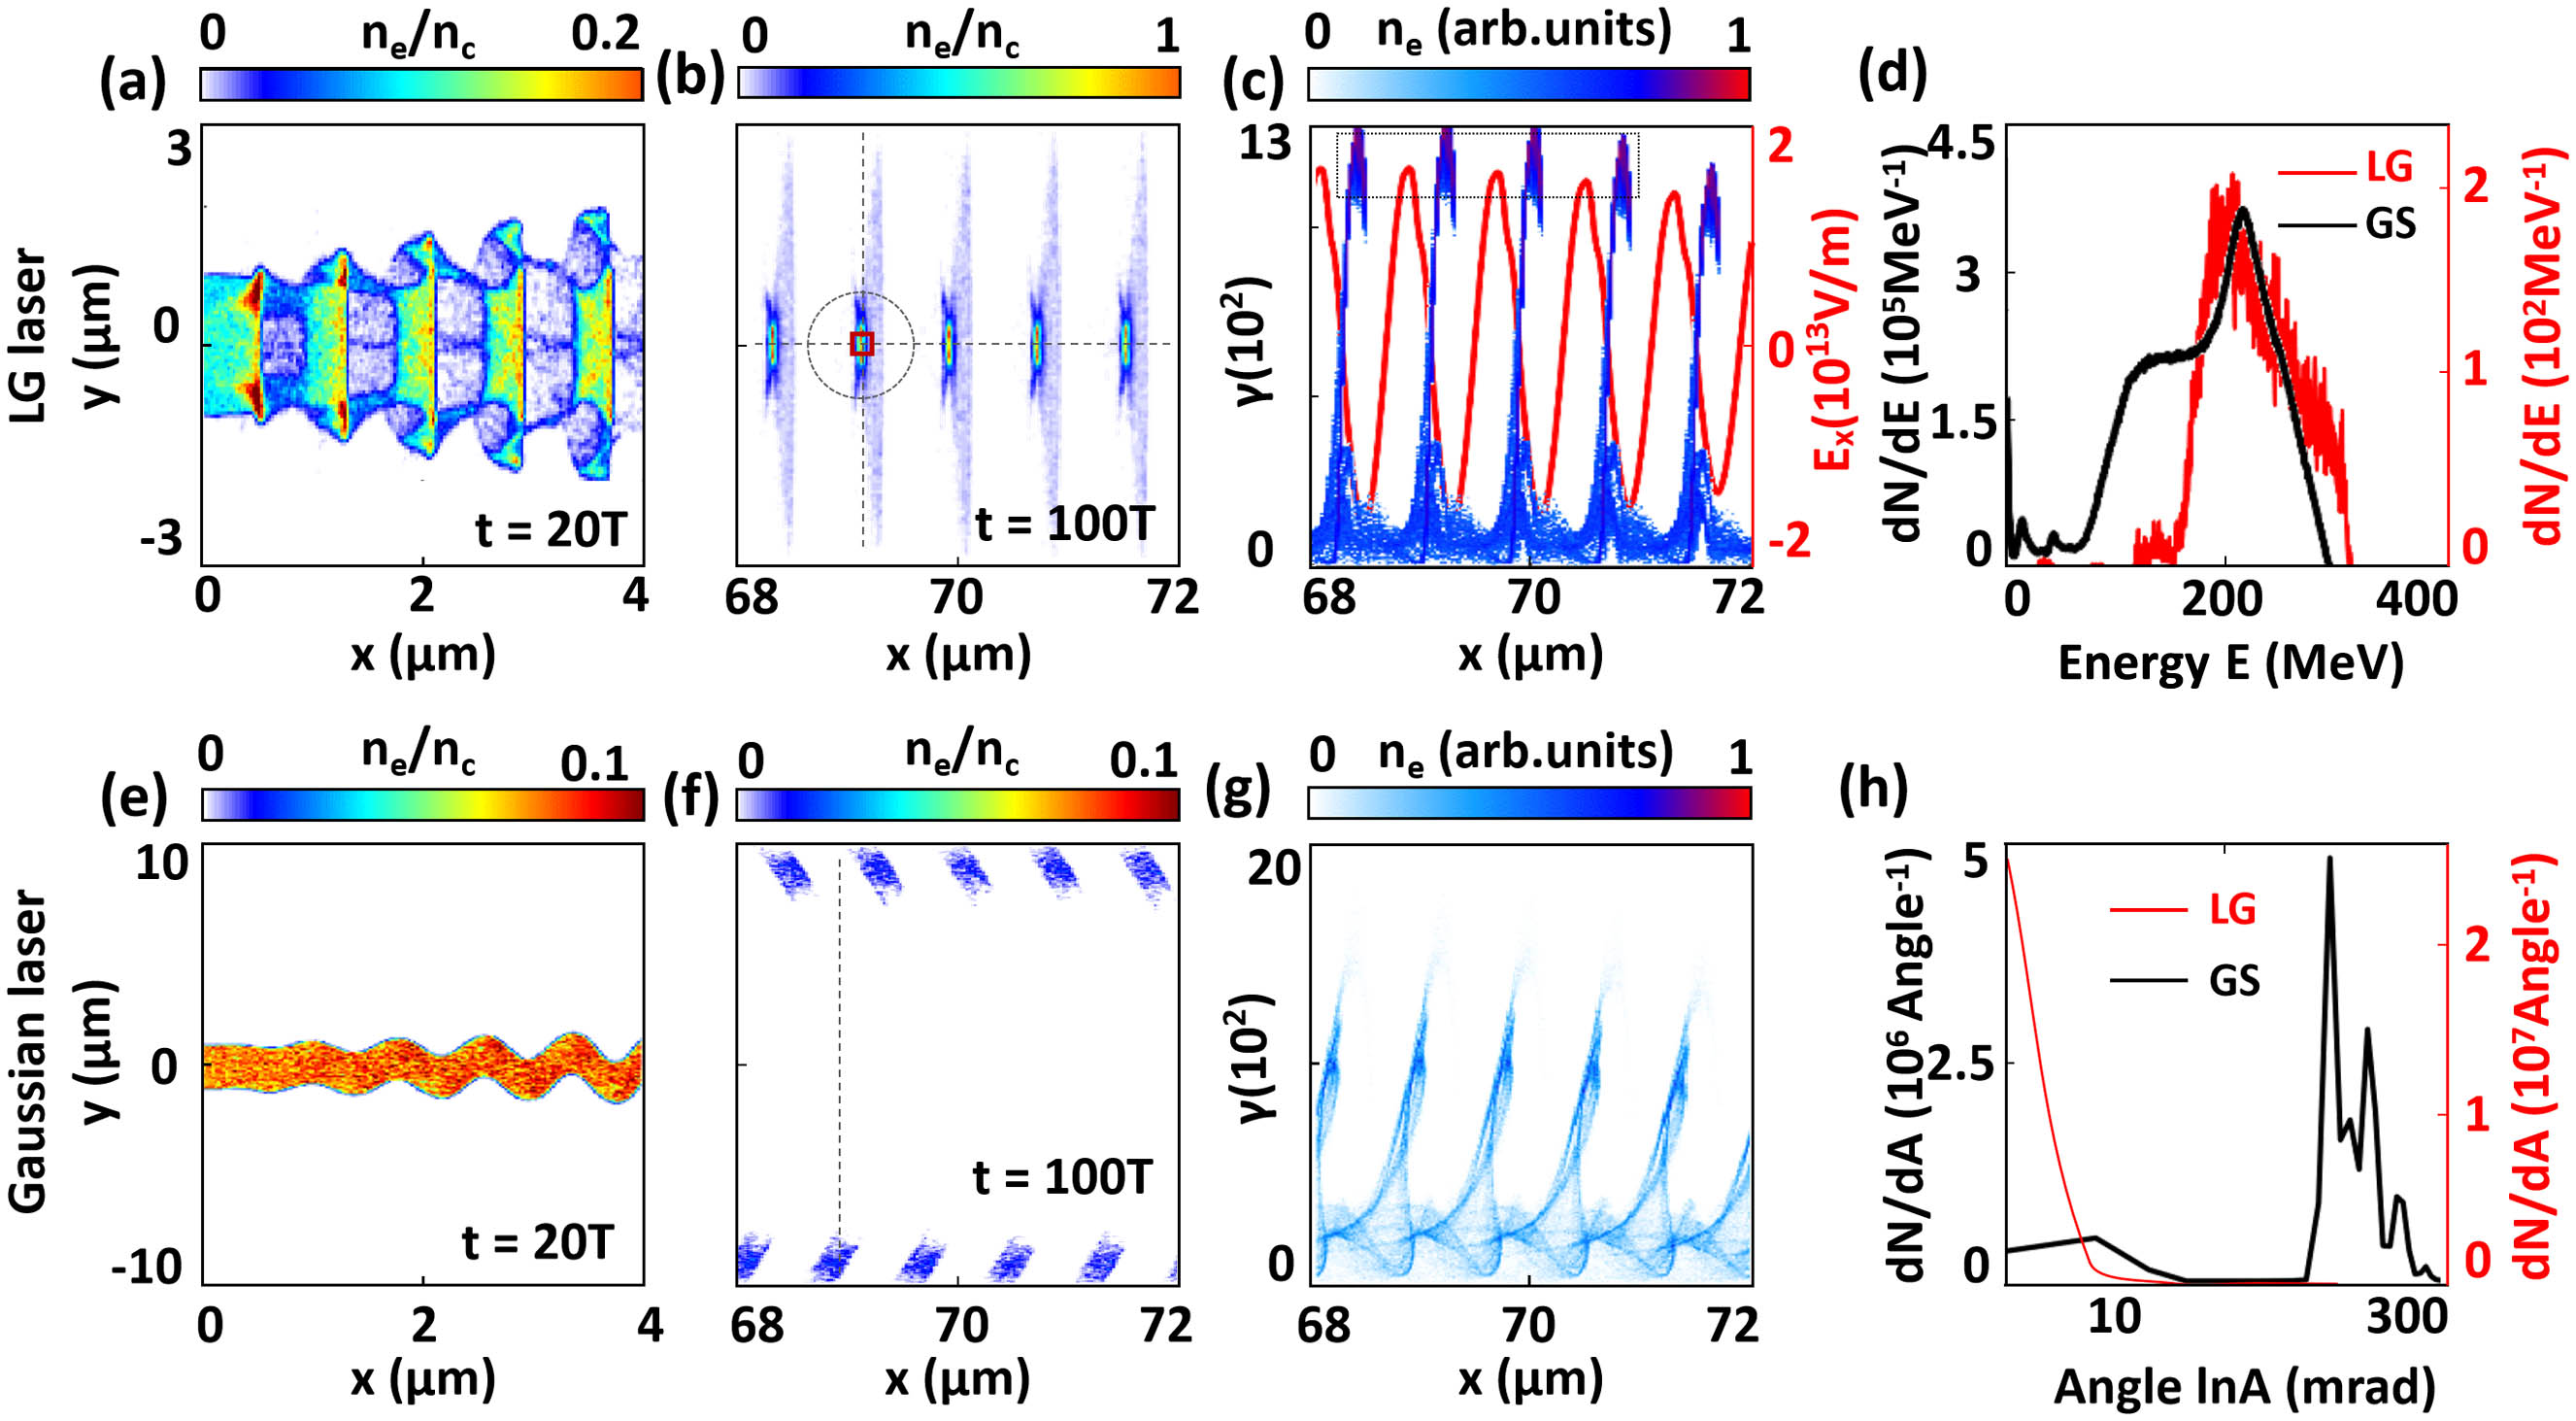
    Fig. 2. (a), (b) Electron density maps generated by the LG laser at 20T and 100T. (e), (f) Electron density maps generated by the Gaussian laser under the same initial conditions as the LG laser. (c), (g) Longitudinal phase space distributions of electrons in (b) and (f). (d), (h) Comparison of the energy spectrum distribution and electron divergence generated by the LG and Gaussian lasers.
    (a) Current distribution modulated by the LG laser. Here, λ0 = 0.8 µm. (b) Transverse electron distribution characteristics at 100T. (c) Trajectories of electrons in the multi-particle model. The black and red solid lines represent the electron trajectory in decelerating phase and accelerating phase, respectively. (d) Phase space distribution of electrons and longitudinal electric field (red line) distribution on the x axis at 5T (the hollow black circle represents the tested electrons with a uniform phase gap of 0.25π). Here, areas outlined in red and blue represent accelerating phase and decelerating phase, respectively.
    Fig. 3. (a) Current distribution modulated by the LG laser. Here, λ0 = 0.8 µm. (b) Transverse electron distribution characteristics at 100T. (c) Trajectories of electrons in the multi-particle model. The black and red solid lines represent the electron trajectory in decelerating phase and accelerating phase, respectively. (d) Phase space distribution of electrons and longitudinal electric field (red line) distribution on the x axis at 5T (the hollow black circle represents the tested electrons with a uniform phase gap of 0.25π). Here, areas outlined in red and blue represent accelerating phase and decelerating phase, respectively.
    Comparison of the degree of bunching effects produced using a conventional undulator (CHG)[22], PEHG scheme[13], and the method proposed in this study. The red solid line represents the fitting line of the bunching effect. The x axis represents the modulation time of the electron beam and laser field.
    Fig. 4. Comparison of the degree of bunching effects produced using a conventional undulator (CHG)[22], PEHG scheme[13], and the method proposed in this study. The red solid line represents the fitting line of the bunching effect. The x axis represents the modulation time of the electron beam and laser field.
    Shufa Hao, Zhengxing Lv, Hao Dong, Jianzhi He, Nanshun Huang, Fengyu Sun, Zhiyong Shi, Hao Sun, Wenpeng Wang, Yuxin Leng, Ruxin Li, Zhizhan Xu. High-gradient modulation of microbunchings using a minimized system driven by a vortex laser[J]. Chinese Optics Letters, 2023, 21(9): 093801
    Download Citation