• Geographical Research
  • Vol. 39, Issue 8, 1892 (2020)
Yuanyuan LIU1、2, Shaoqiang WANG1、2、3、*, Xiaobo WANG1、2, Dong JIANG1、2, H Ravindranath N4, Rahman Atiq5, Mar Htwe Nyo6, and Vijitpan Tartirose7
Author Affiliations
  • 1Key Laboratory of Ecosystem Network Observation and Modeling, Institute of Geographic Sciences and Natural Resources Research, CAS, Beijing 100101, China
  • 2College of Resources and Environment at University of Chinese Academy of Sciences, Beijing 100049, China
  • 3School of Geography and Information Engineering, China University of Geosciences, Wuhan 430074, China
  • 4Centre for Sustainable Technologies, India Institute of Science, Bangalore 560012, India
  • 5Bangladesh Centre for Advanced Studies, Dhaka 1212, Bangladesh
  • 6Yezin Agricultural University, Naypyitaw 15000, Myanmar
  • 7United Nations Environment Programme - International Ecosystem Management Partnership, Beijing 100101, China
  • show less
    DOI: 10.11821/dlyj020190679 Cite this Article
    Yuanyuan LIU, Shaoqiang WANG, Xiaobo WANG, Dong JIANG, H Ravindranath N, Rahman Atiq, Mar Htwe Nyo, Vijitpan Tartirose. Flood risk assessment in Bangladesh, India and Myanmar based on the AHP weight method and entropy weight method[J]. Geographical Research, 2020, 39(8): 1892 Copy Citation Text show less
    Distribution of altitude and river systems in BIM region
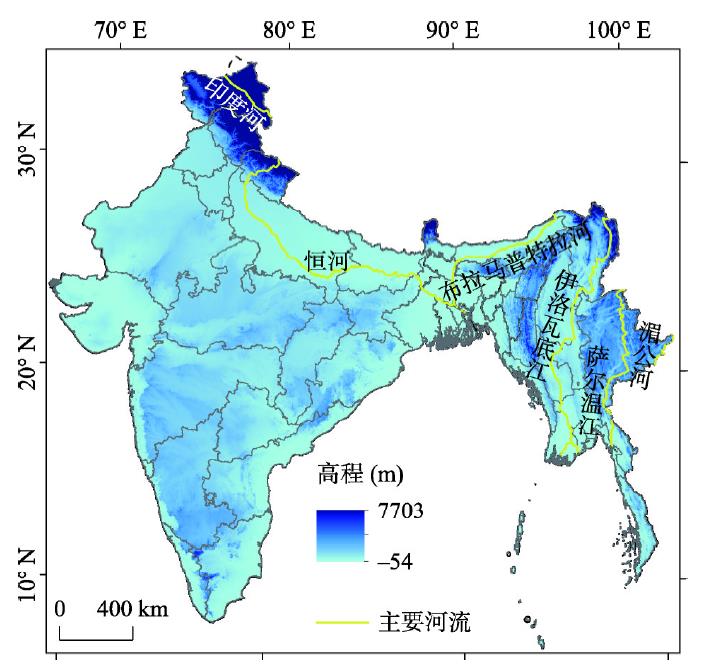
    Fig. 1. Distribution of altitude and river systems in BIM region
    Monthly precipitation from 2010 to 2017 in BIM region
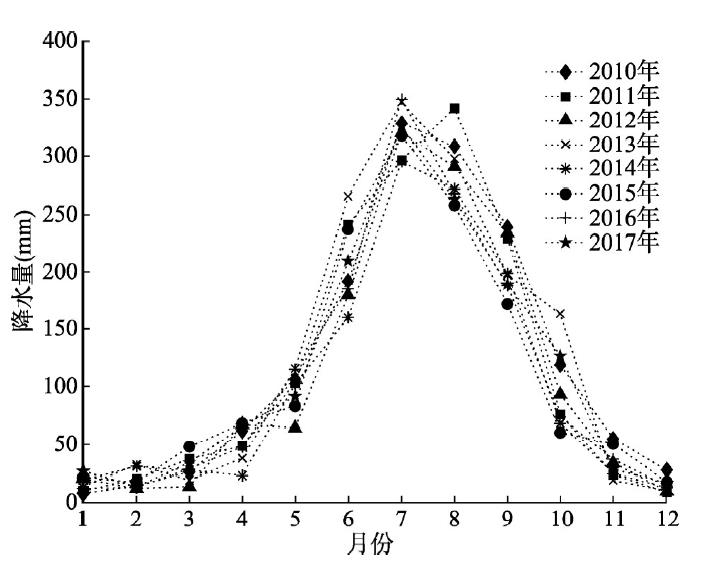
    Fig. 2. Monthly precipitation from 2010 to 2017 in BIM region
    Index system of flood risk assessment
    Fig. 3. Index system of flood risk assessment
    Spatial distribution of hazard indexes in BIM region from 1980 to 2016
    Fig. 4. Spatial distribution of hazard indexes in BIM region from 1980 to 2016
    Spatial distribution of sensibility indexes in BIM region
    Fig. 5. Spatial distribution of sensibility indexes in BIM region
    Land use mapping in BIM region in 2013
    Fig. 6. Land use mapping in BIM region in 2013
    Spatial distribution of vulnerability indexes in BIM region
    Fig. 7. Spatial distribution of vulnerability indexes in BIM region
    Spatial distribution of regional flood risk
    Fig. 8. Spatial distribution of regional flood risk
    目标层指标层子指标层权重
    层次分析法熵权法组合法
    洪涝灾害风险指数危险性(0.4)雨季降雨量0.50000.73730.590
    暴雨天数0.50000.26270.410
    敏感性(0.4)坡度0.25870.05370.190
    高程0.32090.02340.222
    土壤可蚀性0.09290.27170.152
    植被覆盖度0.09290.31980.168
    河网密度0.23460.33150.267
    易损性(0.2)人口密度0.69420.00260.629
    地均GDP0.21030.00910.191
    土地利用0.09550.98830.180
    Table 1. Weight of flood risk index
    风险等级孟加拉国比例(%)印度比例(%)缅甸比例(%)孟印缅全区比例(%)
    AHPAHP_熵权AHPAHP_熵权AHPAHP_熵权AHPAHP_熵权
    6.607.7531.9931.7257.6157.9835.5635.45
    较低0.961.485.937.924.866.915.577.51
    中等11.9914.2830.4830.3117.8215.7827.6427.23
    较高73.1365.8731.3429.6918.9517.0230.6528.76
    7.3210.610.260.360.752.310.591.05
    Table 2. Ratios of flood risk levels in different countries
    Yuanyuan LIU, Shaoqiang WANG, Xiaobo WANG, Dong JIANG, H Ravindranath N, Rahman Atiq, Mar Htwe Nyo, Vijitpan Tartirose. Flood risk assessment in Bangladesh, India and Myanmar based on the AHP weight method and entropy weight method[J]. Geographical Research, 2020, 39(8): 1892
    Download Citation