
Wenyu Du, Sen Gao, Xiaojuan Zhang, Siqi Li, Yan Kuai, Zhiqiang Wang, Zhigang Cao, Feng Xu, Yu Liu, Lin Xu, Junxi Zhang, Kang Xie, Benli Yu, Zhijia Hu. Picosecond gain-switched polymer fiber random lasers[J]. Chinese Optics Letters, 2024, 22(4): 040603
- Chinese Optics Letters
- Vol. 22, Issue 4, 040603 (2024)
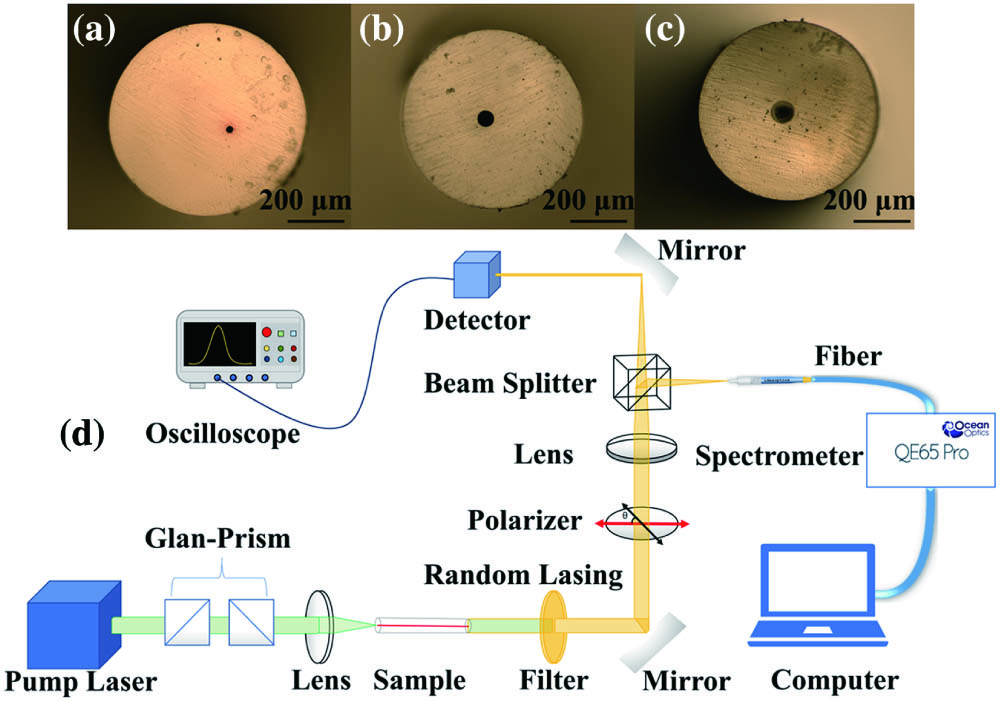
Fig. 1. Optical micrographs of three types of disordered POF cross sections, corresponding to (a) POPOF, (b) FePOF, and (c) AuPOF; (d) experimental setup for testing RL emission.
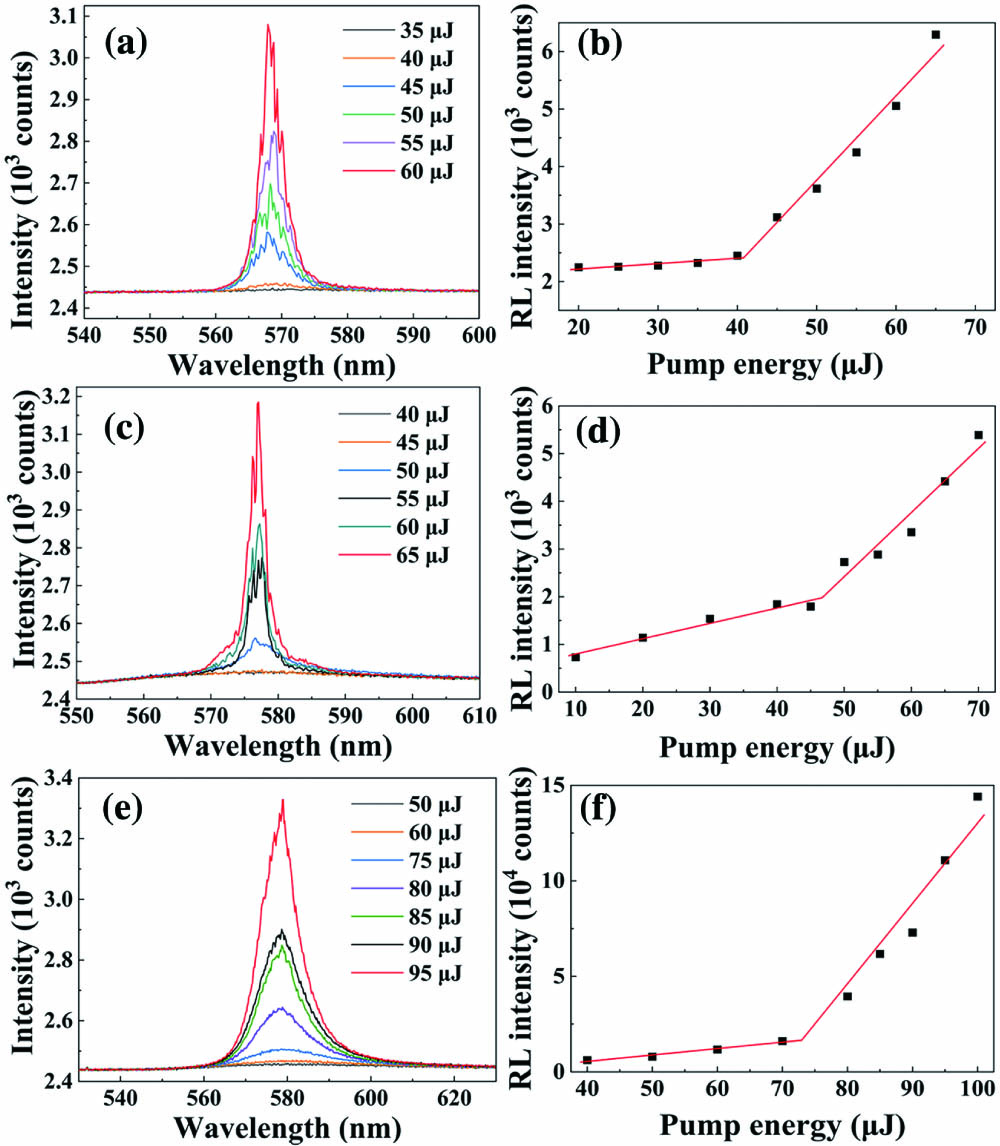
Fig. 2. RL emission property of three POFs. The emission spectrum variations with pump energy of POPOF, FePOF, and AuPOF are shown in (a), (c), and (e), respectively. The variations of integral intensity with pump energy of POPOF, FePOF, and AuPOF are shown in (b), (d), and (f), respectively.
Fig. 3. RL pulse characteristic of polymer fibers. The normalized time distributions for POPOF, FePOF, and AuPOF are shown in (a), (c), and (e), respectively. The emission pulse widths of POPOF, FePOF, and AuPOF are shown in (b), (d), and (f), respectively. The red dotted line represents the threshold for the random lasing emission spectrum.
Fig. 4. (a) Simulation of gain and RL pulse compression. The red line is the gain curve of the RLs. The blue line is the pump laser pulse. The green line is the fluorescence pulse below the threshold. The black line is the RL pulse. (b) Simulation of pulse width variation when pump energy is below and above the threshold.
Fig. 5. (a) Normalized periodic distribution of short pulse RLs within 1 s. Inset, an enlarged view of an RL pulse. (b) Simultaneous acquisition of pump laser and RL pulses.
Fig. 6. (a) Linewidth of the three POFs at 35,000 pumps; (b) the pulse width of RLs varies with the angle θ.
|
Table 1. Parameters of POFs
|
Table 2. Single Exponential Decay Fitting of Temporal Properties

Set citation alerts for the article
Please enter your email address
© Copyright 2018-2021 | Chinese Laser Press. All Rights Reserved 沪ICP备15018463号-20