• Journal of Geo-information Science
  • Vol. 22, Issue 2, 198 (2020)
Yongshu ZHANG1、1、*, Zhenkai YANG1、1, Lu ZI1、1, Yibing CAO1、1, and Hang YU2、2
Author Affiliations
  • 1Institute of Geographic Space Information, Information Engineering University, Zhengzhou 450001, China
  • 1信息工程大学地理空间信息学院,郑州 450001
  • 277535 Troops, Lasa 850000, China
  • 277535部队,拉萨 850000
  • show less
    DOI: 10.12082/dqxxkx.2020.190199 Cite this Article
    Yongshu ZHANG, Zhenkai YANG, Lu ZI, Yibing CAO, Hang YU. Spatio-temporal Evolution of the AIDS Pattern in China[J]. Journal of Geo-information Science, 2020, 22(2): 198 Copy Citation Text show less
    The spatial distribution of AIDS incidence rate in China in 2016
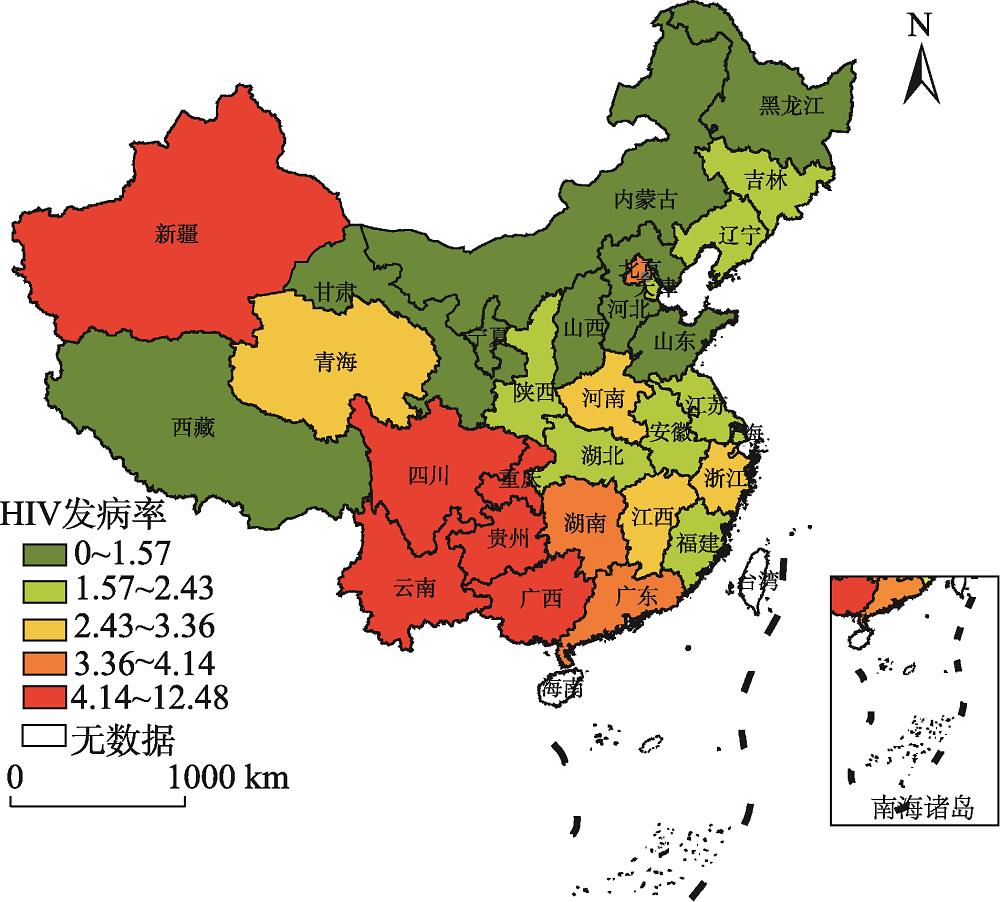
    Fig. 1. The spatial distribution of AIDS incidence rate in China in 2016
    Temporal trend of the Global Moran's I of AIDS incidence rate in China from 1997 to 2016
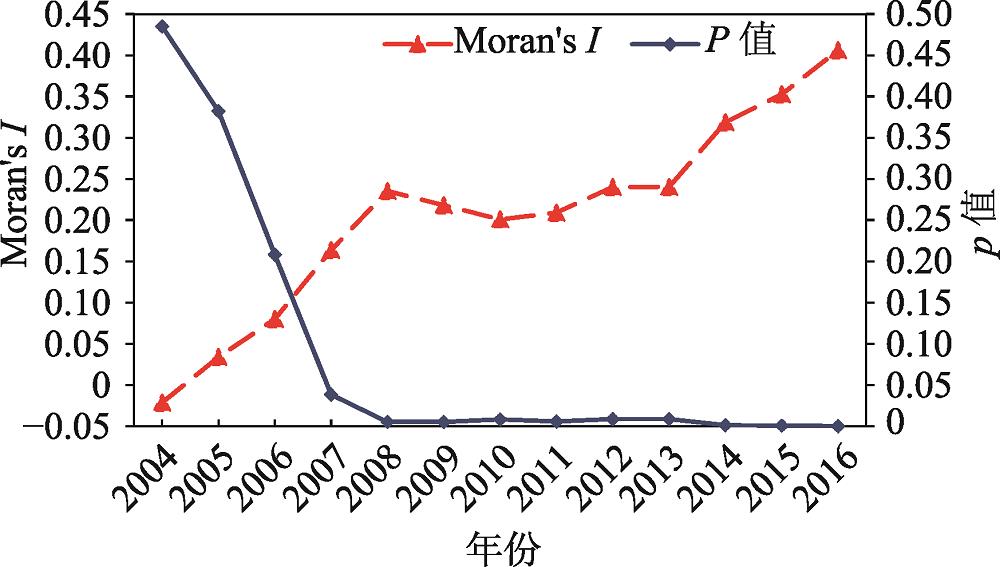
    Fig. 2. Temporal trend of the Global Moran's I of AIDS incidence rate in China from 1997 to 2016
    LISA cluster maps of the distribution of AIDS incidence rate in China from 1997 to 2016
    Fig. 3. LISA cluster maps of the distribution of AIDS incidence rate in China from 1997 to 2016
    Significance test results of the local spatial autocorrelation of AIDS incidence rate in China from 1997 to 2016
    Fig. 4. Significance test results of the local spatial autocorrelation of AIDS incidence rate in China from 1997 to 2016
    Centroid movement path of the AIDS incidence rate in China from 1997 to 2016
    Fig. 5. Centroid movement path of the AIDS incidence rate in China from 1997 to 2016
    年份Moran's Ip 年份Moran's Ip
    19970.06600.357920070.16360.0383
    1998-0.04240.417120080.23530.0051
    19990.01830.478120090.21810.0051
    2000-0.04870.390220100.20090.0081
    2001-0.04300.433120110.20910.0057
    2002-0.03430.420220120.24020.0086
    20030.03690.342020130.24020.0086
    2004-0.02130.445120140.31870.0013
    20050.03390.382120150.35260.0006
    20060.08000.208220160.40610.0001
    Table 1. Calculation results of global Moran's I of AIDS incidence rate in China from 1997 to 2016
    年份低—低低—高高—低高—高
    1997内蒙古—陕西—河南广西
    2001新疆—青海广西
    2006内蒙古—吉林—辽宁—宁夏贵州新疆广西—广东
    2011内蒙古—吉林—辽宁—宁夏湖南—贵州新疆—河南云南—广西
    2016内蒙古—辽宁—河北—山西—宁夏—河南西藏湖南—云南—贵州—广西
    Table 2. Regions of the four spatial association modes of AIDS incidence rate in China from 1997 to 2016
    年份属性阶段观测值属性变化强度重心转移距离/km重心转移方向
    19970.0025
    19980.01203.8057.44东北50.67
    19990.01510.2665.61东北85.33
    20000.02220.4752.71东北56.53
    20010.03500.58122.01东北59.42
    20020.05880.6843.94东南60.19
    20030.08490.44126.12东北50.35
    20040.23491.7749.07东北63.28
    20050.43240.84114.86西南7.76
    20060.51020.18240.65西南50.59
    20070.74000.4551.99西南32.22
    20080.76130.0346.87东南81.17
    20091.00010.3140.82西北22.07
    20101.19740.2060.16东北62.28
    20111.52510.2718.58西北79.92
    20123.11201.04177.27西北32.77
    20133.22300.04100.26东北5.64
    20143.33130.0342.20东北14.79
    20153.69400.1139.81东北75.76
    20163.96560.0728.11东北58.47
    Table 3. Calculation results of the centroid movement path method of AIDS incidence rate in China from 1997 to 2016
    Yongshu ZHANG, Zhenkai YANG, Lu ZI, Yibing CAO, Hang YU. Spatio-temporal Evolution of the AIDS Pattern in China[J]. Journal of Geo-information Science, 2020, 22(2): 198
    Download Citation