Lei Huang1、2、3, Qingli Zhang2、3、*, Jianqiao Luo2、3, Wenpeng Liu2、3, Junrui Zhang1、2、3, Renqin Dou2、3, Guihua Sun2、3, Cong Quan2、3, Yingying Chen2、3、4, Shoujun Ding2、3、5, Yao Liu1、2、3, and Ying Fan2、3、6
Author Affiliations
1School of Environmental Science and Optoelectronic Technology, University of Science and Technology of China, Hefei 230026, Anhui, China2Anhui Provincial Key Laboratory of Photonic Devices and Materials, Anhui Institute of Optics and Fine Mechanics, Hefei Institutes of Physical Science, Chinese Academy of Sciences, Hefei 230031, Anhui, China3Advanced Laser Technology Laboratory of Anhui Province, Hefei 230037, Anhui, China4Science Island Branch, Graduate School, University of Science and Technology of China, Hefei 230026, Anhui, China5School of Microelectronics and Data Science, Anhui University of Technology, Maanshan243002, Anhui, China6Institutes of Physical Science and Information Technology, Anhui University, Hefei 230061, Anhui, Chinashow less
DOI: 10.3788/CJL230665
Cite this Article
Set citation alerts
Lei Huang, Qingli Zhang, Jianqiao Luo, Wenpeng Liu, Junrui Zhang, Renqin Dou, Guihua Sun, Cong Quan, Yingying Chen, Shoujun Ding, Yao Liu, Ying Fan. Growth, Structure, Spectroscopy, and Laser Performance of Nd∶GSAG Crystals[J]. Chinese Journal of Lasers, 2023, 50(23): 2301007
Copy Citation Text
show less
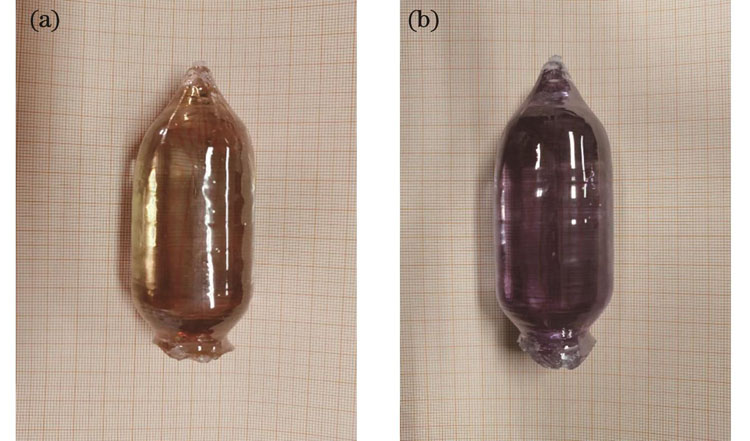
Fig. 1. Nd∶GSAG crystal with doping atomic fraction of 0.94% grown by Czochralski method. (a) Before annealing; (b) after annealing
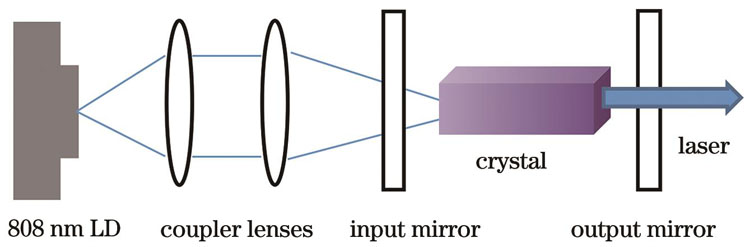
Fig. 2. LD end-pumped laser experimental setup
Fig. 3. Single crystal swing curve of Nd∶GSAG crystal with doping atomic fraction of 0.94%
Fig. 4. X-ray powder diffraction pattern of Nd∶GSAG crystal with doping atomic fraction of 0.94% and GSAG standard pattern ICSD 78052
Fig. 5. Full spectrum fitting of Nd∶GSAG crystal with doping atomic fraction of 0.94%
Fig. 6. Transmission and absorption spectra of Nd∶GSAG crystal with doping atomic fraction of 0.94%. (a) Transmission spectra; (b) absorption spectra
Fig. 7. Emission spectra of Nd∶GSAG crystals and Nd∶YAG crystals. (a) 900‒1400 nm; (b) 1045‒1085 nm
Fig. 8. Fluorescence lifetime decay curves of laser upper level 4F3/2. (a) Nd∶GSAG; (b) Nd∶YAG
Fig. 9. Laser output wavelengths of Nd∶GSAG crystal with doping atomic fraction of 0.94% and Nd∶YAG crystal with doping atomic fraction of 0.6% under different output mirrors. (a) M2; (b) M1
Fig. 10. Laser output powers of Nd∶GSAG crystal with doping atomic fraction of 0.94% and Nd∶YAG crystal with doping atomic fraction of 0.6%
Fig. 11. Beam diameter versus d for lasers with different wavelengths. (a) 942 nm; (b) 946 nm; (c) 1060 nm; (d) 1064 nm
Crystal | Wavelength /nm | Transmittance /% | Absorption coefficient /cm-1 | Absorption cross-section /(10-20 cm2) | FWHM /nm |
---|
Nd∶YAG | 808.4 | 49.19 | 3.56 | 4.30 | 2.79 | 0.94% Nd∶GSAG | 808.5 | 46.52 | 3.79 | 3.41 | 3.23 | 1.20% Nd∶GSAG | 808.5 | 38.95 | 4.97 | 3.50 | 3.28 |
|
Table 1. Absorption characteristic parameters of Nd∶GSAG crystals and Nd∶YAG crystals
Crystal | Transition | Wavelength / nm | Fluorescence branching ratio | Emission cross-section /(10-20 cm2) | Laser threshold /W | Slope efficiency /% | Maximum power /W | Light conversion efficiency /% | Pump light absorptance in crystal /% |
---|
Nd∶GSAG | 4F3/2→4I9/2 | 942 | 0.40 | 2.33 | 3.06 | 5.5 | 0.66 | 4.2 | 68‒83 | Nd∶YAG | 946 | 0.37 | 1.95 | 5.56 | 5.0 | 0.56 | 3.2 | 68‒89 | Nd∶GSAG | 4F3/2→4I11/2 | 1060 | 0.49 | 5.62 | 0.42 | 28.4 | 2.17 | 24.9 | 66‒79 | Nd∶YAG | 1064 | 0.56 | 14.22 | 0.25 | 28.5 | 2.26 | 26.4 | 66‒76 |
|
Table 2. Laser experimental performance parameters of Nd∶GSAG crystal with doping atomic fraction of 0.94% and Nd∶YAG crystal with doping atomic fraction of 0.6%
Crystal | Wavelength /nm | FWHM of laser spectrum /nm | Direction | Beam quality factor | Beam divergence angle /rad | Girdle diameter /mm |
---|
Nd∶GSAG | 942 | 0.53 | Horizontal | 2.72 | 0.03155 | 0.1048 | Vertical | 3.45 | 0.03491 | 0.1185 | 1060 | 0.59 | Horizontal | 2.49 | 0.03029 | 0.1111 | Vertical | 2.63 | 0.03155 | 0.1122 | Nd∶YAG | 946 | 0.66 | Horizontal | 3.81 | 0.03335 | 0.1375 | Vertical | 3.73 | 0.03018 | 0.1488 | 1064 | 0.64 | Horizontal | 3.16 | 0.03295 | 0.1300 | Vertical | 2.71 | 0.03129 | 0.1172 |
|
Table 3. Fitting results of beam quality