
Th. Michel, E. Falize, B. Albertazzi, G. Rigon, Y. Sakawa, T. Sano, H. Shimogawara, R. Kumar, T. Morita, C. Michaut, A. Casner, P. Barroso, P. Mabey, Y. Kuramitsu, S. Laffite, L. Van Box Som, G. Gregori, R. Kodama, N. Ozaki, P. Tzeferacos, D. Lamb, M. Koenig. Analytical modelling of the expansion of a solid obstacle interacting with a radiative shock[J]. High Power Laser Science and Engineering, 2018, 6(2): 02000e30
- High Power Laser Science and Engineering
- Vol. 6, Issue 2, 02000e30 (2018)
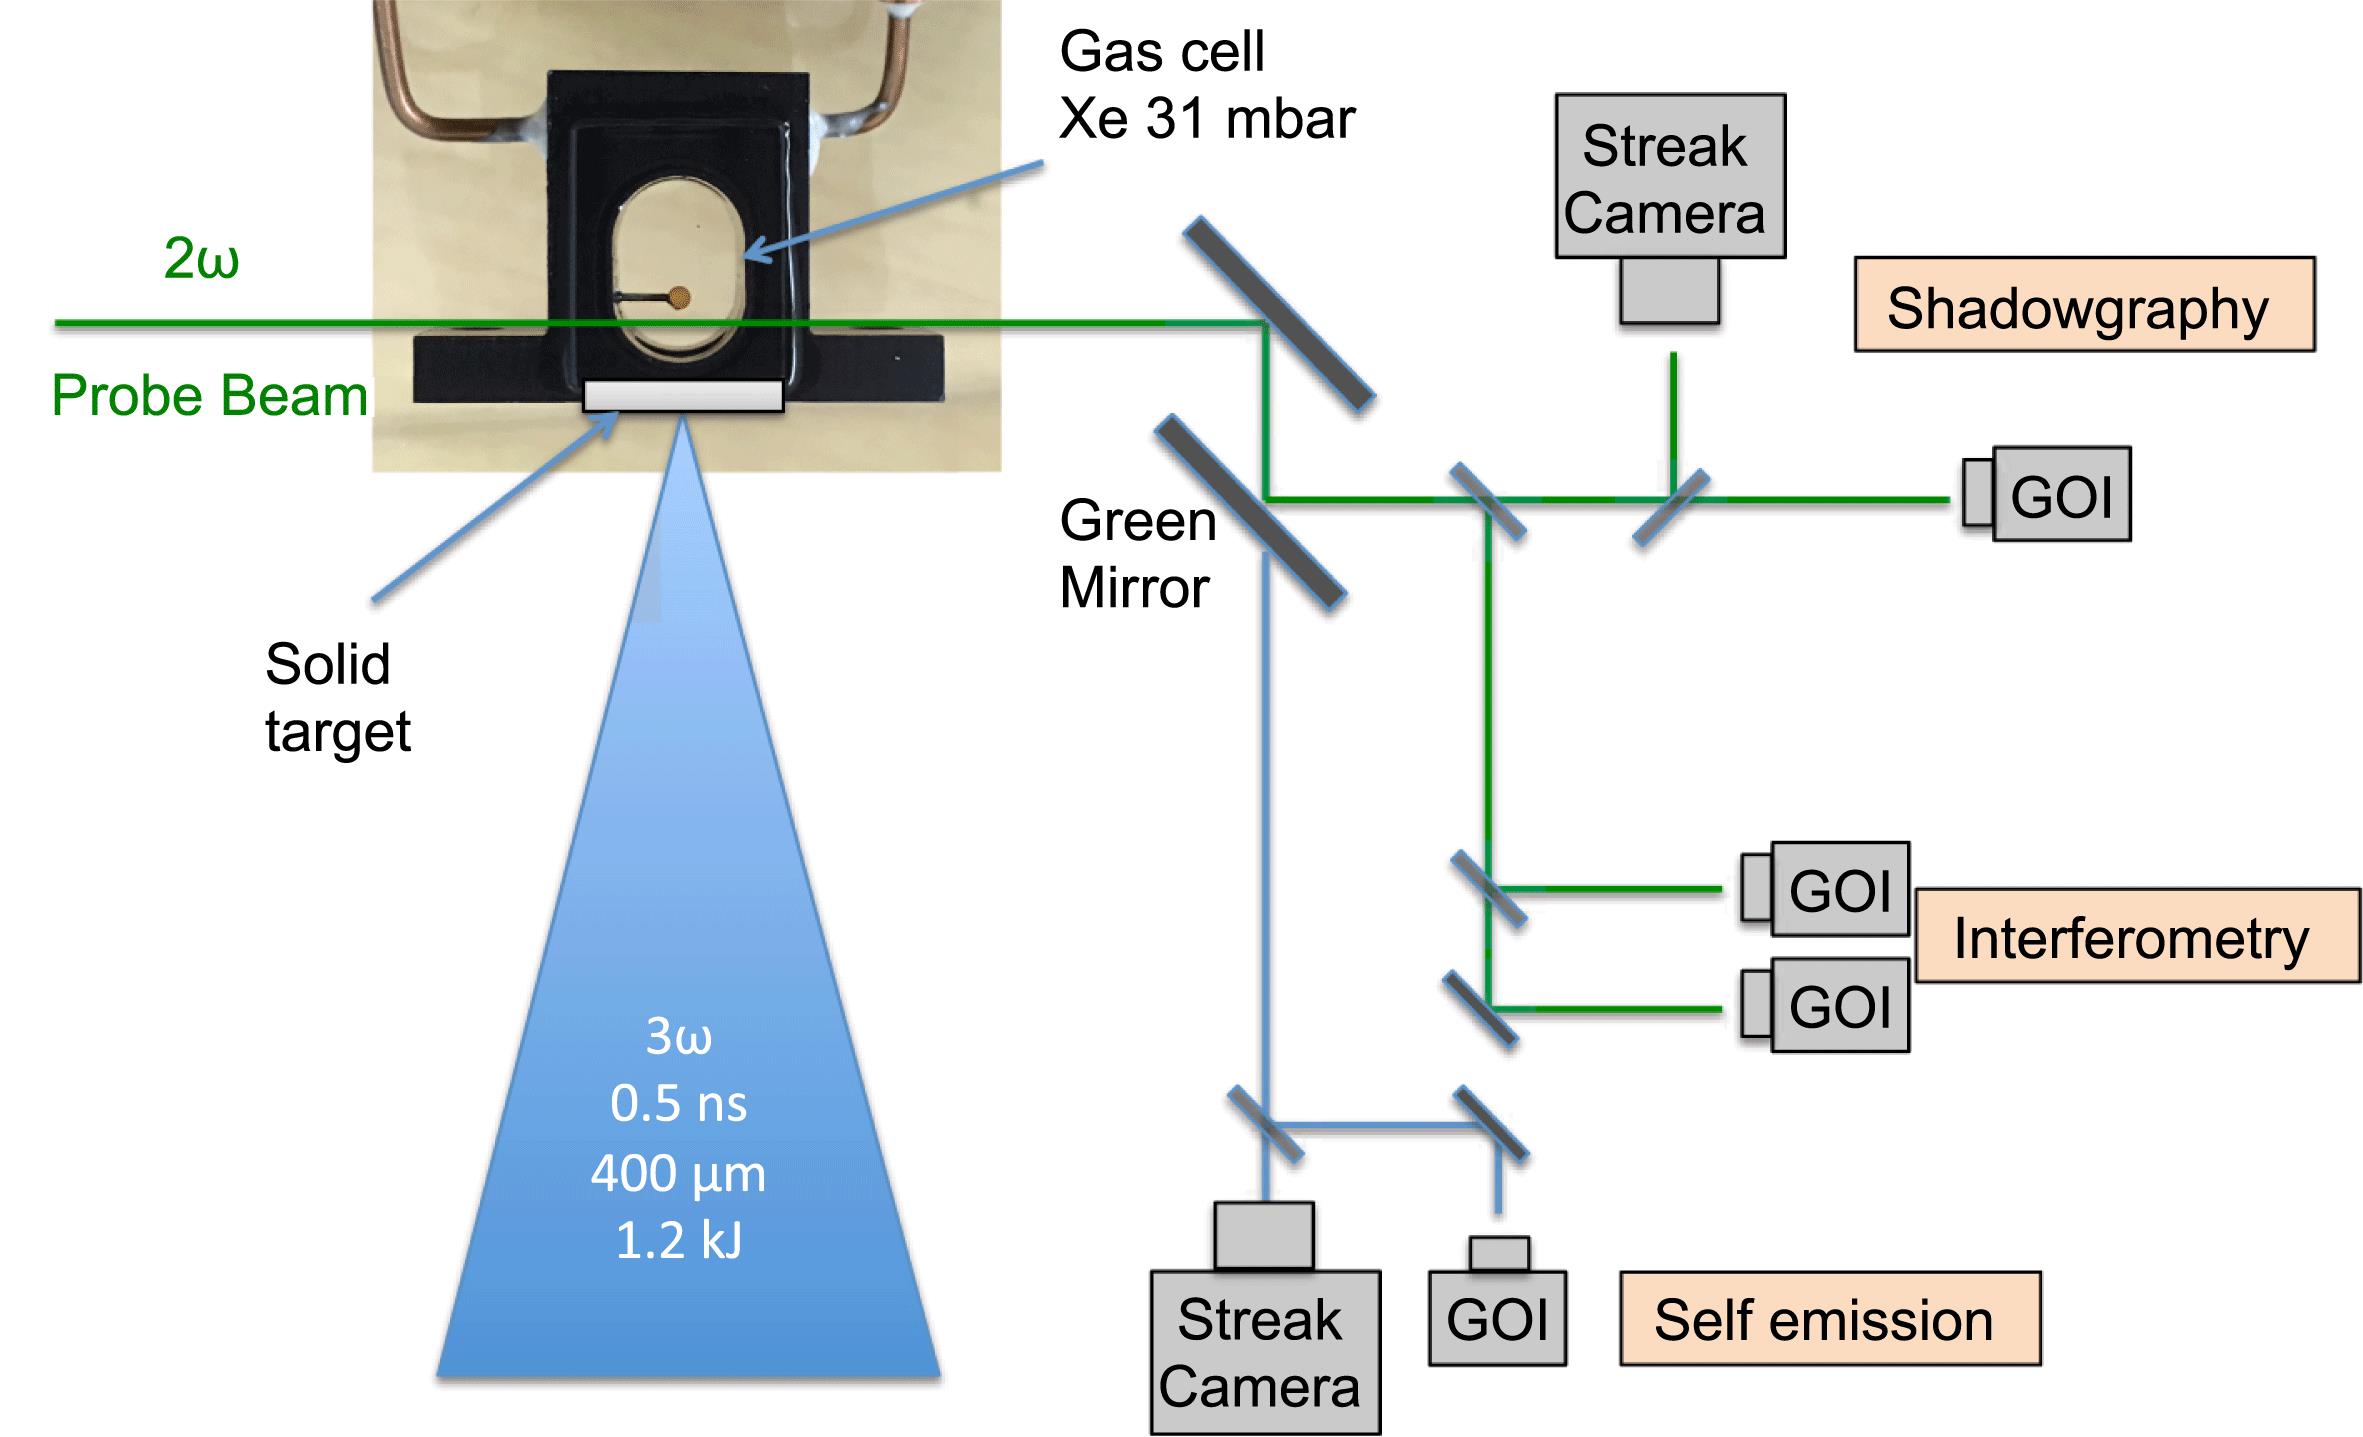
Fig. 1. General setup of the experiment including all visible diagnostics.
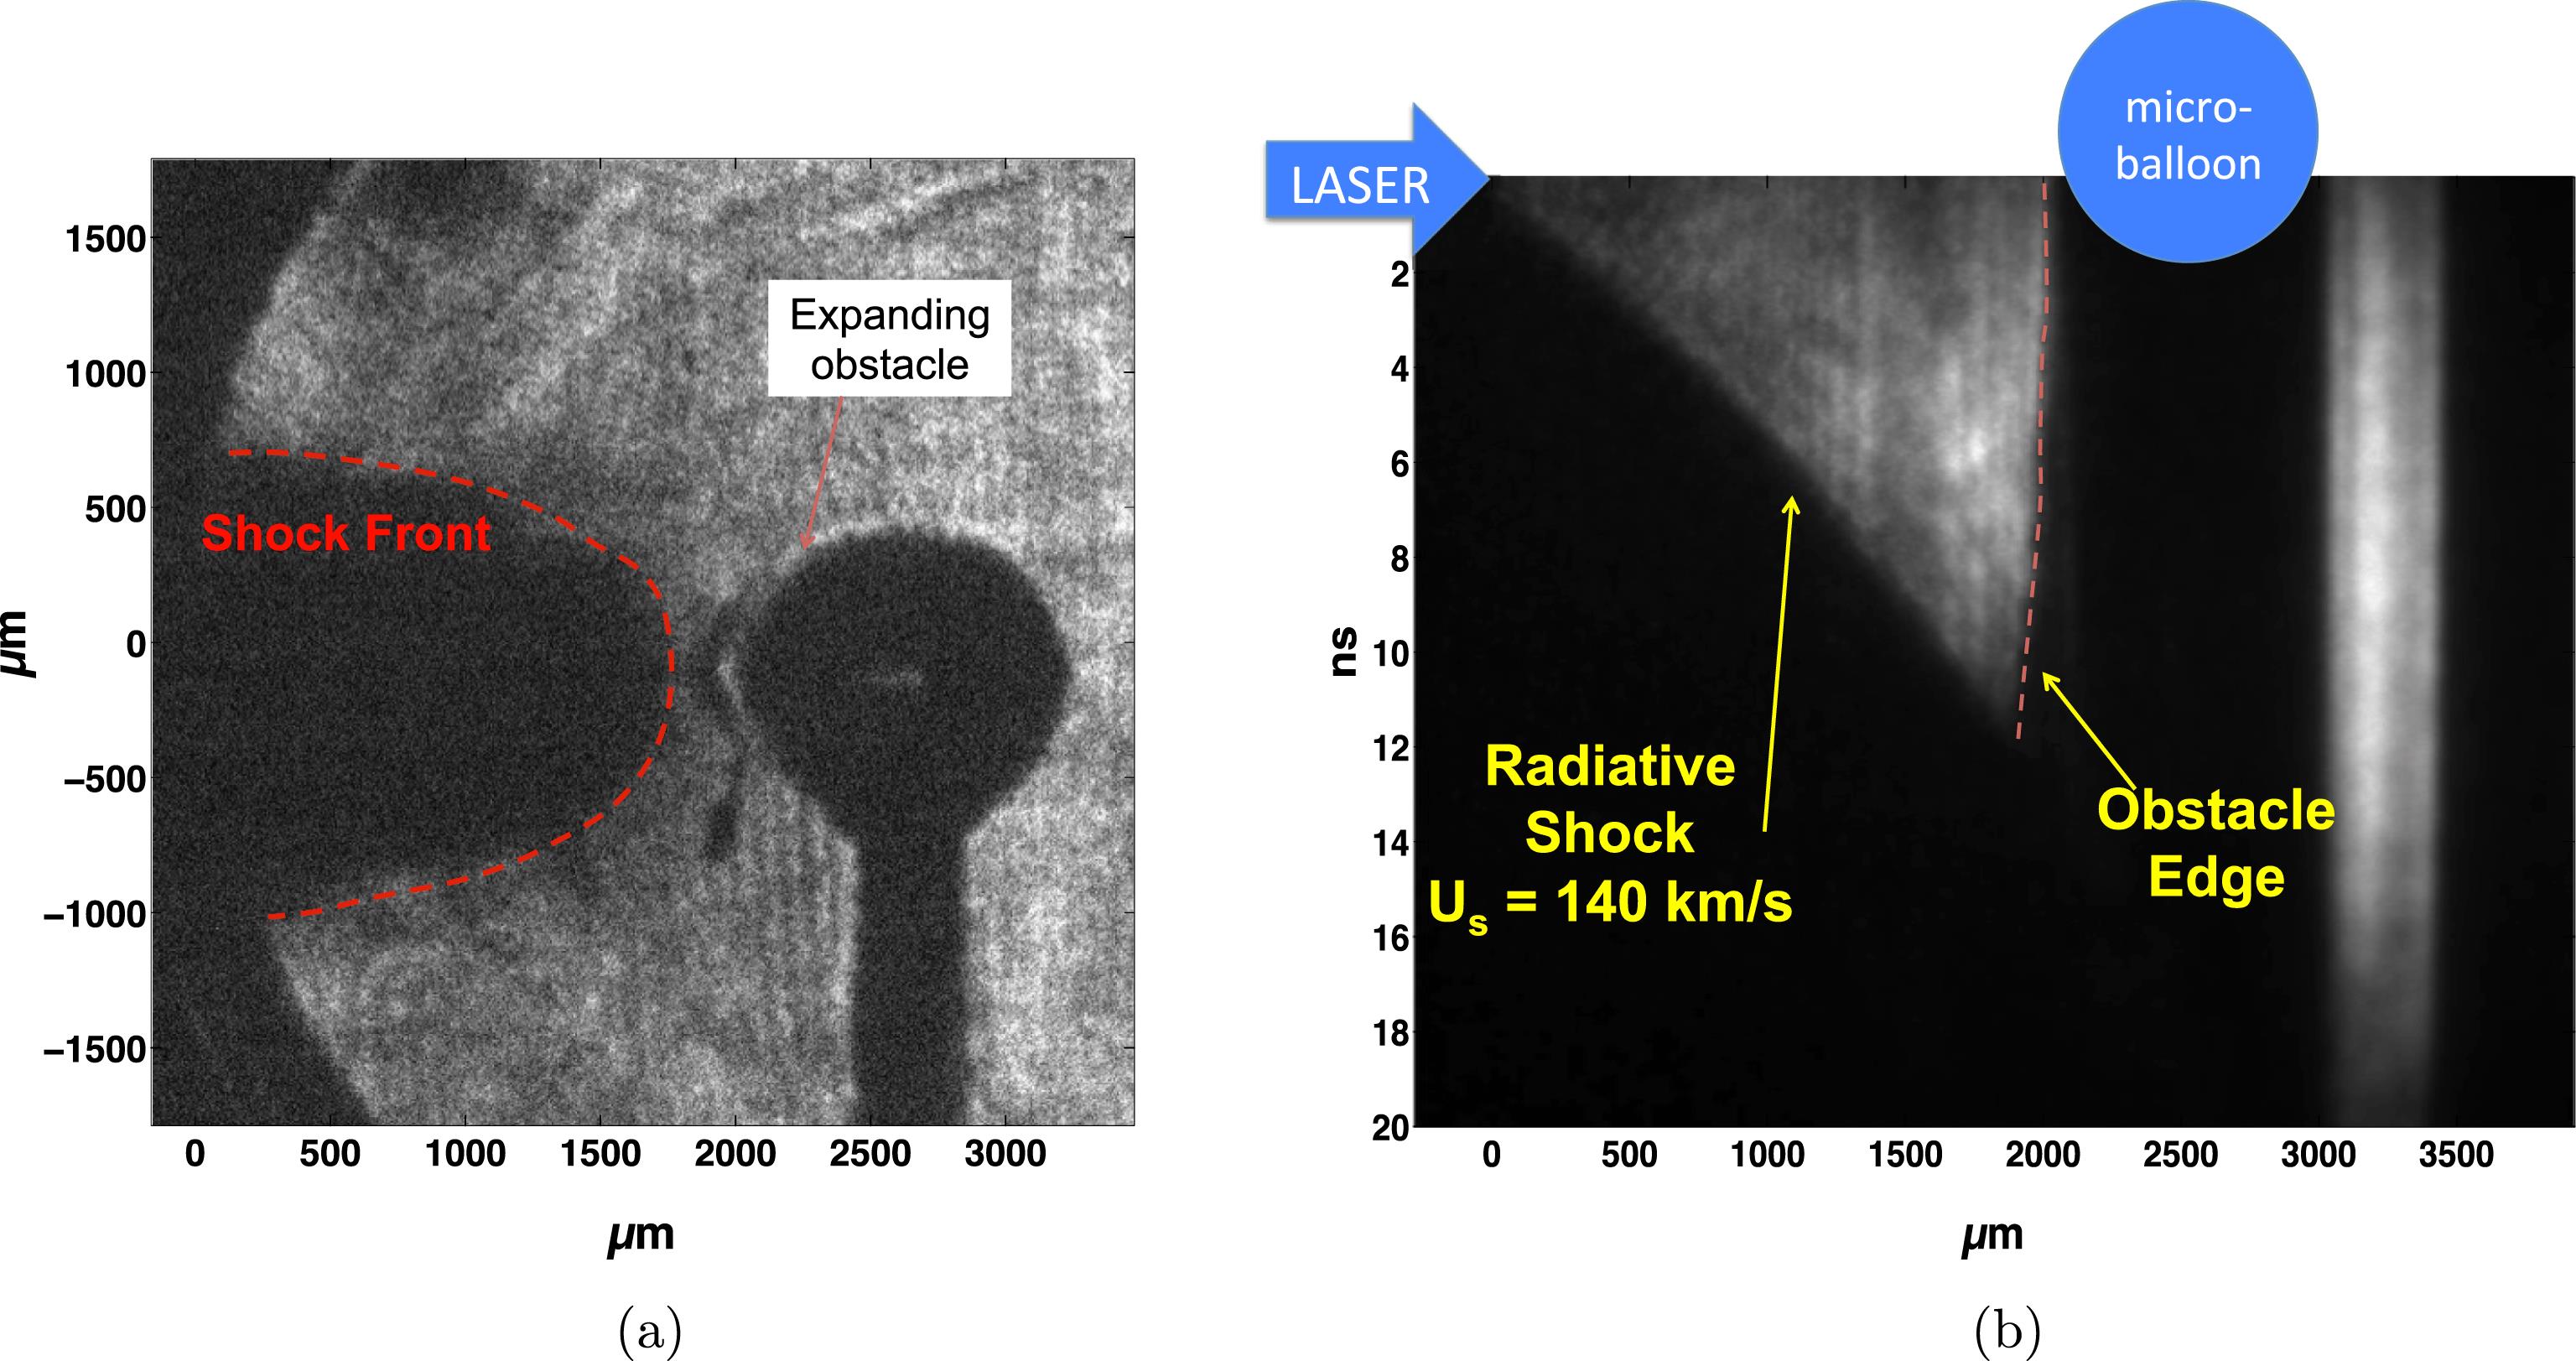
Fig. 2. Shadowgraphy of the RS moving towards the obstacle. (a) A 2D snapshot obtained 10 ns after the drive beams; (b) streaked image that follows the position of the absorbing surface with time.
Fig. 3. Schematic of the shock moving towards the obstacle.
Fig. 4. Spherical shock moving towards the obstacle.
Fig. 5. Comparison between a spherical and a planar shock. The shock velocity is  km/s at 30 eV,
  .
.
km/s at 30 eV, . Fig. 6. Comparison between model, experiment, and simulations. The model parameters, related to the experiment, are  eV,
eV,  km/s, a precursor length of
  and a shock diameter of 1 mm.
eV, km/s, a precursor length of and a shock diameter of 1 mm. Fig. 7. Same as Figure 6 , with experimental data and model expansion with three temperatures (20 eV, 30 eV and 40 eV).
Fig. 8. Same as Figure 7 , with three different initial distances between the target and the obstacle (1 mm, 2 mm, 3 mm).

Set citation alerts for the article
Please enter your email address
© Copyright 2018-2021 | Chinese Laser Press. All Rights Reserved 沪ICP备15018463号-20