• Chinese Journal of Lasers
  • Vol. 50, Issue 23, 2310001 (2023)
Xuejie Gao1、2, Jiqiao Liu1、2、3、*, Chuncan Fan1、3, Cheng Chen1、2、3, Juxin Yang1、2、3, Shiguang Li1, Yuan Xie1, Xiaopeng Zhu1、2, and Weibiao Chen1、2、3
Author Affiliations
  • 1Space Laser Engineering Department, Shanghai Institute of Optics and Fine Mechanics, Chinese Academy of Sciences, Shanghai 201800, China
  • 2Center of Materials Science and Optoelectronics Engineering, University of Chinese Academy of Sciences, Beijing 100049, China
  • 3Key Laboratory of Space Laser Communication and Detection Technology, Shanghai Institute of Optics and Fine Mechanics, Chinese Academy of Sciences, Shanghai 201800, China
  • show less
    DOI: 10.3788/CJL230575 Cite this Article Set citation alerts
    Xuejie Gao, Jiqiao Liu, Chuncan Fan, Cheng Chen, Juxin Yang, Shiguang Li, Yuan Xie, Xiaopeng Zhu, Weibiao Chen. Carbon Dioxide Column Concentration Measurement Based on Cloud Echo Signal of 1.57 μm IPDA Lidar[J]. Chinese Journal of Lasers, 2023, 50(23): 2310001 Copy Citation Text show less
    Schematic diagram of airborne IPDA lidar detection
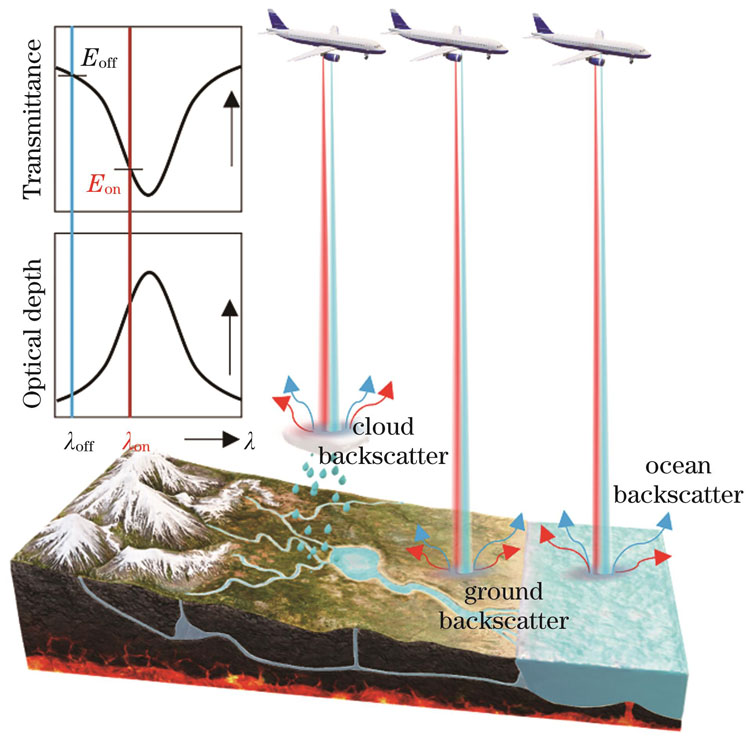
    Fig. 1. Schematic diagram of airborne IPDA lidar detection
    Schematic of IPDA lidar system
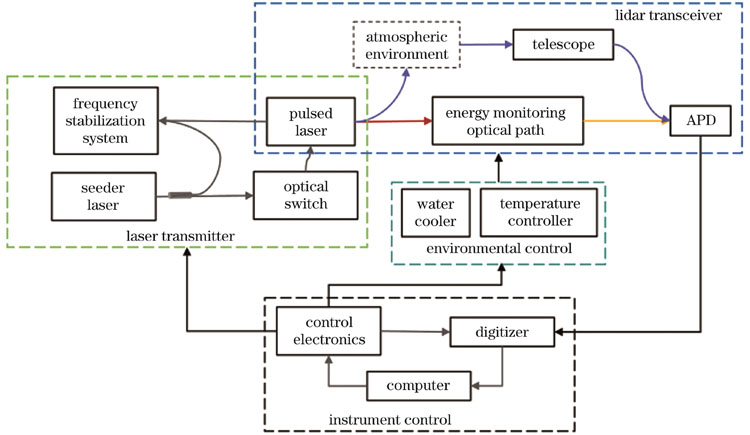
    Fig. 2. Schematic of IPDA lidar system
    Schematic diagram of IPDA lidar transceiver system
    Fig. 3. Schematic diagram of IPDA lidar transceiver system
    Images of clouds taken by onboard camera. From left to right, it is seen that cloud cover increases successively and clouds become thicker
    Fig. 4. Images of clouds taken by onboard camera. From left to right, it is seen that cloud cover increases successively and clouds become thicker
    Data processing flow chart
    Fig. 5. Data processing flow chart
    Schematic diagram of target altitude calibration with airborne lidar
    Fig. 6. Schematic diagram of target altitude calibration with airborne lidar
    Signals received by IPDA lidar. (a) Aliasing cloud echo signal; (b) two-layer cloud echo signal; (c) single-layer cloud echo signal; (d) ground echo signal; (e) cloud and ground echo signals
    Fig. 7. Signals received by IPDA lidar. (a) Aliasing cloud echo signal; (b) two-layer cloud echo signal; (c) single-layer cloud echo signal; (d) ground echo signal; (e) cloud and ground echo signals
    Schematic diagram of cloud signal extraction method. (a) Diagrams of echo signal extraction; (b) diagrams of extracted signal with same integral range
    Fig. 8. Schematic diagram of cloud signal extraction method. (a) Diagrams of echo signal extraction; (b) diagrams of extracted signal with same integral range
    Voltage values of backscatter profile varying with height. (a) Echo signal after altitude correction; (b) comparison of first echo signal before and after altitude correction; (c) comparison of second echo signal before and after altitude correction
    Fig. 9. Voltage values of backscatter profile varying with height. (a) Echo signal after altitude correction; (b) comparison of first echo signal before and after altitude correction; (c) comparison of second echo signal before and after altitude correction
    Summary plot of IPDA lidar measurements on 2019-03-14
    Fig. 10. Summary plot of IPDA lidar measurements on 2019-03-14
    Trends of monitor signal energy and echo signal energy of cloud signal. (a) Online monitor signal; (b) offline monitor signal; (c) online echo signal; (d) offline echo signal
    Fig. 11. Trends of monitor signal energy and echo signal energy of cloud signal. (a) Online monitor signal; (b) offline monitor signal; (c) online echo signal; (d) offline echo signal
    Diagram of relative reflectance of clouds
    Fig. 12. Diagram of relative reflectance of clouds
    Diagram of cloud density distribution
    Fig. 13. Diagram of cloud density distribution
    Images of cloud cover change captured by onboard camera
    Fig. 14. Images of cloud cover change captured by onboard camera
    Comparison between trend of CO2 column concentration on cloud measured by IPDA lidar and trend of single-point CO2 concentration measured by in-situ measuring instrument
    Fig. 15. Comparison between trend of CO2 column concentration on cloud measured by IPDA lidar and trend of single-point CO2 concentration measured by in-situ measuring instrument
    Schematic diagram of CO2 column concentrations on clouds
    Fig. 16. Schematic diagram of CO2 column concentrations on clouds
    ParameterValue
    Wavelength(on/off)/nm1572.024/1572.085
    Pulse energy(on/off)/mJ6/3
    Pulse width(on/off)/ns17
    Pulse separation /μs200
    Optical frequency /Hz30
    Emission optical efficiency0.8955
    Receiver optical efficiency0.3797
    Telescope diameter /mm150
    Data acquisition rate /(MSa·s-1125
    Vertical sampling resolution /m1.2
    Horizontal footprint resolution /m3.7
    Table 1. Main system parameters of airborne 1.57 μm double-pulse IPDA lidar
    Xuejie Gao, Jiqiao Liu, Chuncan Fan, Cheng Chen, Juxin Yang, Shiguang Li, Yuan Xie, Xiaopeng Zhu, Weibiao Chen. Carbon Dioxide Column Concentration Measurement Based on Cloud Echo Signal of 1.57 μm IPDA Lidar[J]. Chinese Journal of Lasers, 2023, 50(23): 2310001
    Download Citation