Abstract
Graphene microfibers are burgeoning modulators with great potential in all-optical communication. One of the critical issues that remains to be understood is the dynamic mechanism of light–graphene interaction. Here, we propose a power dependent modulation by using 980 nm pump light and 1064 nm signal light via graphene microfiber, and the results show a strong transmission reduction and frequency blue shift with the increase of pump power. The experimental observation is attributed to a stimulated Brillouin scattering process induced by the pump light. Power and frequency variations are a result of energy transition of the scattered phonon in the fiber. This work reveals the nonlinear effect process in the light–graphene interaction and provides a new method for power and frequency control with graphene all-optical modulation.1. INTRODUCTION
All-optical modulation is a rapidly growing technology with prospects for future data rate processing in optical telecommunication. As a potential candidate approach to break the “electronic bottleneck” of a few tens of gigahertz in the current electro-optic communication system [1], all-optical modulation has attracted increasing research attention [2–5]. Experimentally, all-optical modulation can be achieved through a number of matters (Rb atomic vapor [6], CdSe quantum dots [7], two-dimensional materials [8,9], etc.) and optical structures (silicon microcavities [10], photonic crystal microcavities [11], composite waveguides [12], etc.). Among them, the microfiber integrated optical modulator is regarded as the most promising one in practical applications [13,14] due to natural compatibility with commercial telecommunication systems. To manipulate light propagating along fiber, two-dimensional (2D) materials are novel candidates by means of evanescent wave coupling. Graphene, as one of the most promising 2D materials, has shown extraordinary photonic and optoelectronic properties, such as a zero band gap structure and ultrafast carrier relaxation (100 fs of intraband and several picoseconds of interband transitions) [15]. Thanks to the all-optical modulation mechanism, graphene microfiber (GMF) modulators have wide optical response bandwidth and ultrafast light modulation speed. So far, modulations on light intensity, phase, and polarization by light have been demonstrated through GMF modulators. Besides its use in modulators, GMF has also shown potential applications in the field of sensing with high sensitivity and fast response [16].
In principle, the physics of the modulation mechanism in the GMF modulator is still not clear. For example, Pauli blocking is always adopted to illustrate the power dependent optical modulation [4,17]. In some cases, the signal power decreases rather than increases with the rise of pump power, and no clear explanation on such a phenomenon has been reported so far. On the other hand, red shift of the signal light is attributed to the thermal effect of the GMF when the pump light is strong [18].
To study the all-optical modulation mechanism of the GMF, we designed a modulation experiment by using single-frequency continuous wave (CW) lasers with wavelengths of 980 nm and 1064 nm as the pump and signal light, respectively. The power of the pump light was increased to interact with the GMF and, therefore, affect the transmission of the signal light. From the signal light transmission spectra, we observed power decline and frequency blue shift with the increase of pump power. To fully understand the physical mechanism of this process, we propose Brillouin scattering of the signal light enhanced by the stimulated Brillouin scattering (SBS) process of the pump light. This work provides useful information in understanding the behavior of the light in the GMF, which is of value not only in all-optical modulation, but also in GMF sensors.
Sign up for Photonics Research TOC. Get the latest issue of Photonics Research delivered right to you!Sign up now
2. EXPERIMENTAL DETAILS
Figure 1 schematically shows the experimental setup. Two laser sources are employed to serve as pump light (980 nm) and signal light (1064 nm), respectively. The pump light is generated by a continuous wave Ti:sapphire laser (Spectra-Physics, Matisse TR) with linewidth of 10 MHz and maximum power of 900 mW. The signal light is a home-built single-frequency fiber laser [19], which gives a linewidth of 15.2 kHz, and a fixed power of 6 mW at 1064.33 nm. The two laser beams are coupled into the GMF through a 980/1064 nm wavelength-division multiplexer (WDM). The GMF device is connected with the WDM to enable light–graphene interaction via evanescent field coupling. After, the transmitted laser is extracted by an optical circulator (C) connected with a fiber Bragg grating (FBG, 1063.98 nm central wavelength, 0.6 nm bandwidth). The signal light is then reflected by the FBG and output from port 3 of the circulator. The pump light can be detected from the right end of the FBG. An optical spectral analyzer (YOKOGAWA, AQ6370C) with 0.02 nm resolution is used to analyze the modulated signal.
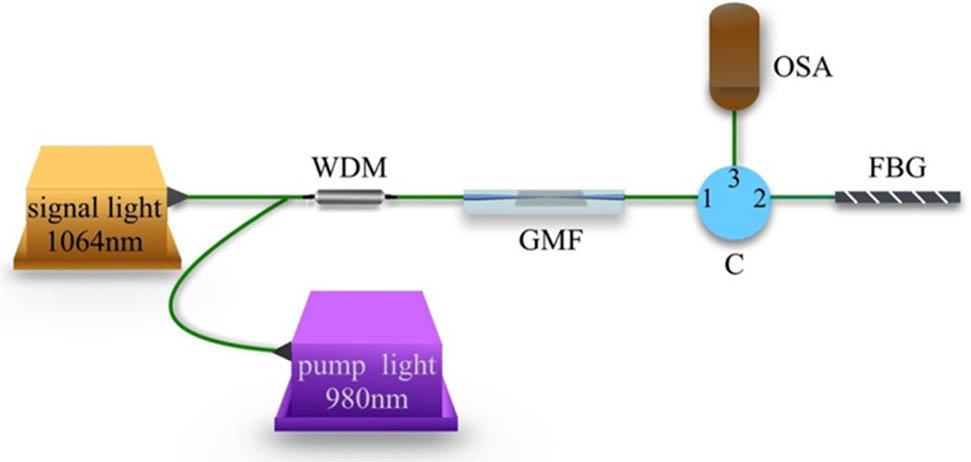
Figure 1.Scheme of the experimental setup. WDM, wavelength-division multiplexer; GMF, graphene microfiber; C, fiber optical circulator; FBG, fiber Bragg grating; OSA, optical spectral analyzer.
Figure 2(a) shows the configuration of the GMF. A silicon wafer coated by a film is used as the substrate. Microfiber is placed between two graphene films. To create microfiber, a standard telecommunication single-mode fiber was pulled under high temperature, which was controlled by an electrical heating molybdenum wire. The diameter of the microfiber was monitored with an optical microscope. After pulling, we examined the light transmission by injecting and collecting light from the un-tapered parts. We can routinely get the right transmission larger than 90% over the full fiber, indicating that the tapering process is approximately adiabatic. Then, we employed microfibers with diameters of 2 μm, 4 μm, and 8 μm to fabricate GMF devices. From the microscope image of the microfiber [Fig. 2(a)], we can roughly estimate that the length of the microfiber (waist region) is about 1 cm.

Figure 2.Schematic of the GMF. (a) Microscope image of the microfiber. (b) Raman spectrum of the graphene. (c) SEM image of the GMF. (d)–(f) Close-up SEM images of the dashed frame area from the GMF shown in (c).
The graphene used for the GMF was synthesized on a copper foil by the chemical vapor deposition (CVD) method [20]. The Raman spectrum shown in Fig. 2(b) confirms that the graphene we made is monolayer. The copper foil was etched with 15% ferric chloride solution. Afterwards, the graphene film was washed in deionized water several times until the solution was clear and transparent. Then, we sank the coated silicon substrate in the solution, and drew water until the graphene film stacked on the substrate. The monolayer graphene transferred substrate was then dried in a vacuum oven for 3 h at 45°C. The microfiber and top graphene layer were subsequently transferred to the surface of the bottom graphene layer. The microfiber was fixed with ultraviolet glue. Figures 2(c)–2(f) show the scanning electron microscope (SEM) images of the GMF. It is seen that the coating length is about 3 mm.
3. RESULTS AND DISCUSSION
The spectra of the signal light modulated by the pump power are shown in Figs. 3(a)–3(c). Figure 3(d) is a transmission spectrum of the signal light from the 2 μm diameter microfiber without graphene. During the experiment, the signal light power was fixed at 6 mW. In Figs. 3(a) and 3(b), it is obviously seen that the transmitted signal light power decreases with the increase of the pump power. Meanwhile, the central wavelength of the spectrum shifts to a shorter wavelength (i.e., blue shift). It should be noted that the power decline and blue shift of the signal light only happen when the pump power exceeds a threshold of 25 mW for the 2 μm diameter GMF and 280 mW for the 4 μm diameter GMF. In contrast, no modulation was observed in the 8 μm diameter GMF [Fig. 3(c)] and the 2 μm microfiber not covered with graphene [Fig. 3(d)]. Our experimental results are different from the previous observations [4,17,18], in which the signal power always decreases and the central wavelength red shifts as the pump power increases. Those results were typically explained by Pauli blocking [4,17] and the thermal effect of the graphene energy band and the device [18].
Figure 3.Modulated signal light as a function of the pump light power for the GMF using microfiber of (a) 2 μm, (b) 4 μm, and (c) 8 μm diameters. (d) Comparison of microfiber (with 2 μm diameter) without graphene coating.
To explain the experimental results, we consider that the signal light experiences Brillouin scattering on the phonons generated in the SBS process of the pump light. In principle, the Brillouin scattering process can be regarded as a photon (with frequency of ) scattered on a phonon (with frequency of ), generating a Stokes photon with the frequency of or an anti-Stokes photon with the frequency of [21–23]. Different from the photons and phonons in the bulk material, which can propagate along any direction, photons and phonons in fiber can only propagate forward or backward. Due to the Doppler effect, when the phonon moves backward, as shown in Fig. 4(a), the backward scattering light possesses higher frequency (anti-Stokes light), and the forward scattering light exhibits lower frequency (Stokes light) [23]. In contrast, when the phonon moves forward, as shown in Fig. 4(b), Stokes light is scattered backward, and the anti-Stokes light is scattered forward. Because the frequency of the phonon (Brillouin frequency shift) depends on the magnitude of strain and temperature change, Brillouin scattering is an important method in sensing [24]. In this work, when the intense pump light propagates along the microfiber, a strong evanescent field can be generated, which therefore interacts with the graphene. Since graphene has higher third-order nonlinear susceptibility than silica [25,26], the evanescent field can produce efficient SBS in graphene, and a large number of forward moving phonons will be produced [Fig. 4(c)] [27] at the same time. When the signal light goes through the modulator, it can be scattered by the forward moving phonons, producing backward propagating Stokes light and forward propagating anti-Stokes light [Fig. 4(d)].
Figure 4.Illustration of the Brillouin scattering in the fiber as the phontons move (a) backward and (b) forward. (c) Phonon generation in the SBS process of the pump beam. (d) Brillouin scattering of the signal beam on the phonons.
According to the scattering model, the output signal light contains both anti-Stokes light and Rayleigh scattering light. To identify this, we decomposed the signal spectra obtained from the 2 μm diameter GMF [Fig. 3(a)] by using least-squares fitting. The calculated spectral curves of the anti-Stokes light and the Rayleigh scattering light are shown in Fig. 5(a). Apparently, the Rayleigh spectrum centers at 1064.33 nm, and its power decreases as the pump power increases. The spectrum of the anti-Stokes light centers at 1064.31 nm, in which the power increases with the increase of the pump power. Besides, the central wavelengths of the anti-Stokes light remain constant as the pump power increases. We also decomposed the signal spectra obtained from the 4 μm diameter GMF [Fig. 3(b)] and found similar results; i.e., it also contains Rayleigh light and anti-Stokes light at 1064.33 nm and 1064.31 nm, respectively, and shows the same power variation. The frequency shift of the anti-Stokes light from the Rayleigh light is calculated to be 6.4 GHz as shown in Fig. 5. In principle, the frequency shift is equal to the frequency of the phonon, which is usually defined by the material. In single-mode fiber, it is calculated to be 16 GHz at 1064 nm according to ( is the frequency shift, is the refractive index, and is the wavelength of the light) [28,29]. It can be seen that the frequency shift of the anti-Stokes light obtained in our experiment is quite close to the frequency of the phonon in single-mode fiber.
Figure 5.Decomposition of the signal spectra obtained from the GMF with the microfiber diameters of (a) 2 μm and (b) 4 μm.
To prove the proposed theory, we measured the backward propagating light from the GMF using 2 μm microfiber. The setup is shown in Fig. 6(a). Two laser sources are employed to serve as pump light (980 nm) and signal light (1064 nm), respectively. The pump light is generated by a CW Ti:sapphire laser (Spectra-Physics, Matisse TR) with linewidth of 10 MHz and maximum power of 900 mW. The signal light is a home-built single-frequency fiber laser, which gives a linewidth of 15.2 kHz, and a fixed power of 6 mW at 1064.33 nm. The two laser beams are coupled into port 1 of the optical circulator (C) through a 980/1064 nm WDM, and then into the GMF device connected to port 2 of the optical circulator. The backward scattering light from the GMF is received by an optical spectral analyzer (YOKOGAWA, AQ6370C) with 0.02 nm resolution connected to port 3 of the circulator. From the spectra of the backward propagating light under various pump powers [Fig. 6(b)], it is seen that the central wavelength remains at 1064.35 nm, with a red frequency shift of about 7.1 GHz with respect to the input signal light. The frequency shift is almost the same as the blue frequency shift measured from the forward propagating light. Therefore, it should be the Stokes light in the Brillouin scattering. Moreover, its power increases with increasing pump power, indicating that the Brillouin scattering of the signal light is enhanced when the pump power is increased.
Figure 6.(a) Experimental setup used to measure the guided acoustic-wave Brillouin scattering from the GMF with a 2 μm diameter. (b) Spectra of the backward propagating light from the GMF with a 2 μm diameter under various pump powers. The central wavelength remains at 1064.35 nm.
The power variation and the blue shift phenomenon can be easily interpreted with the proposed theory. If we denote the power of the Stokes light, the anti-Stokes light, and the Rayleigh scattering light as , , and , respectively, the total power () is supposed to be equivalent to the power of the input signal light , i.e., . The number of forward moving phonons increases as the pump power increases, which enhances both the Stokes light and the anti-Stokes light. In our experiment, the forward propagating light includes anti-Stokes light and Rayleigh scattering light. As a result, the forward detected power can be expressed as . Because the power of the input signal light is fixed and the Stokes light power increases (Fig. 6), the detected power decreases as a consequence [Figs. 3(a) and 3(b)]. Moreover, the power variations lead to the blue shift phenomenon, because the power of the Rayleigh scattering light with lower frequency drops, and the power of the anti-Stokes light with higher frequency increases. Namely, the high frequency part of the spectrum becomes dominant, leading to the entire spectrum profile moving to the higher frequency side.
Similar to commercial single-mode fibers, the SBS threshold in biconical microfibers can be expressed as the following formula [30]: in which is the effective mode area, is the peak Brillouin gain, and is the effective length. The peak Brillouin gain is closely related to the spectral linewidth of the pump laser. For example, if the pump spectrum is Lorentzian, the peak Brillouin gain can be expressed as [31], in which is the Brillouin coefficient, is the SBS gain spectral width, and is the spectral width of the pump laser. Obviously, a higher peak Brillouin gain can be obtained when a narrow linewidth pump laser is used, and a lower SBS threshold can be achieved accordingly. Compared with the lasers used in previous publications, the lasers (both the pump laser and the signal laser) used in this work show narrow linewidth (10 MHz and 15.2 kHz, respectively), which is the reason why we obtained opposite results in the experiment.
According to Eq. (1), the SBS threshold can be calculated. For the biconical microfibers, , , and , therefore, the calculated threshold is 1.37 W. The maximum pump power in the experiment is 900 mW, which is much lower than the SBS threshold. This is the main reason why we did not observe blue shift and power drop of the signal light in bare microfiber [Fig. 3(d)]. As the third-order susceptibility of the graphene is much larger than that of the fiber, the SBS threshold of the GMF is reduced significantly, and, therefore, blue shift and power drop of the signal light in the 2 μm diameter GMF [Fig. 3(a)] were observed.
In the microfibers, the evanescent field is stronger for a smaller diameter. That accounts for the lower threshold of the GMF with a smaller diameter. We then numerically simulated the relationship between the evanescent field distribution and the fiber diameter by using COMSOL Multiphysics. In the simulation model, we assumed that the air layer was a decently matched layer because the coating layer was stripped before heating and stretching. The evanescent field distribution in the fibers with diameters of 0.5 μm, 1 μm, 2 μm, and 4 μm was obtained and is shown in Fig. 7. It can be seen that a smaller fiber diameter gives a stronger evanescent field along the fiber surface, therefore resulting in a stronger interaction between light and graphene.
Figure 7.Simulated evanescent field distribution in the microfiber with diameters of (a) 0.5 μm, (b) 1 μm, (c) 2 μm, and (d) 4 μm.
4. CONCLUSIONS
In conclusion, we investigated all-optical modulation of GMF. Single-frequency CW lasers centered at wavelengths of 980 nm and 1064 nm were used as pump and signal light, respectively. It is found that the power of signal light decreases and blue shifts with the increase of the pump power. This was not observed if graphene was removed from the GMF. Brillouin scattering of the signal on the photons generated in the SBS process of the pump light was used to explain the experimental results. This work provides an effective approach to understanding the modulation mechanism of the GMF modulator, which would be useful for future applications of all-optical modulation. This work provides useful information in understanding the behavior of the light in the GMF, which is of value not only in all-optical modulation, but also in GMF sensors.
References
[1] D. J. Richardson. Silicon photonics: beating the electronics bottleneck. Nat. Photonics, 3, 562-564(2009).
[2] S. L. Yu, X. Q. Wu, K. R. Chen, B. G. Chen, X. Guo, D. X. Dai, L. M. Tong, W. T. Liu, Y. R. Shen. All-optical graphene modulator based on optical Kerr phase shift. Optica, 3, 541-544(2016).
[3] Y. Ding, X. Zhu, S. Xiao, H. Hu, L. H. Frandsen, N. A. Mortensen, K. Yvind. Effective electro-optical modulation with high extinction ratio by a graphene-silicon microring resonator. Nano Lett., 15, 4393-4400(2015).
[4] W. Li, B. Chen, C. Meng, W. Fang, Y. Xiao, X. Li, Z. Hu, Y. Xu, L. Tong, H. Wang. Ultrafast all-optical graphene modulator. Nano Lett., 14, 955-959(2014).
[5] J. H. Chen, B. C. Zheng, G. H. Shao, S. J. Ge, F. Xu, Y. Q. Lu. An all-optical modulator based on a stereo graphene-microfiber structure. Light Sci. Appl., 4, e360(2015).
[6] A. M. Dawes, L. Illing, S. M. Clark, D. J. Gauthier. All-optical switching in rubidium vapor. Science, 308, 672-674(2005).
[7] D. Pacifici, H. J. Lezec, H. A. Atwater. All-optical modulation by plasmonic excitation of CdSe quantum dots. Nat. Photonics, 1, 402-406(2007).
[8] A. C. Ferrari, F. Bonaccorso, V. Fal’ko, K. S. Novoselov, S. Roche, P. Bøggild, S. Borini, F. H. L. Koppens, V. Palermo, N. Pugno, J. A. Garrido, R. Sordan, A. Bianco, L. Ballerini, M. Prato, E. Lidorikis, J. Kivioja, C. Marinelli, T. Ryhänen, A. Morpurgo, J. N. Coleman, V. Nicolosi, L. Colombo, A. Fert, M. Garcia-Hernandez, A. Bachtold, G. F. Schneider, F. Guinea, C. Dekker, M. Barbone, Z. Sun, C. Galiotis, A. N. Grigorenko, G. Konstantatos, A. Kis, M. Katsnelson, L. Vandersypen, A. Loiseau, V. Morandi, D. Neumaier, E. Treossi, V. Pellegrini, M. Polini, A. Tredicucci, G. M. Williams, B. H. Hong, J.-H. Ahn, J. M. Kim, H. Zirath, B. J. van Wees, H. van der Zant, L. Occhipinti, A. Di Matteo, I. A. Kinloch, T. Seyller, E. Quesnel, X. Feng, K. Teo, N. Rupesinghe, P. Hakonen, S. R. T. Neil, Q. Tannock, T. Löfwander, J. Kinaret. Science and technology roadmap for graphene, related two-dimensional crystals, and hybrid systems. Nanoscale, 7, 4598-4810(2015).
[9] Z. P. Sun, A. Martinez, F. Wang. Optical modulators with 2D layered materials. Nat. Photonics, 10, 227-238(2016).
[10] V. R. Almeida, C. A. Barrios, R. R. Panepucci, M. Lipson. All-optical control of light on a silicon chip. Nature, 431, 1081-1084(2004).
[11] X. Y. Hu, P. Jiang, C. Y. Ding, H. Yang, Q. H. Gong. Picosecond and low-power all-optical switching based on an organic photonic-bandgap microcavity. Nat. Photonics, 2, 185-189(2008).
[12] C. Koos, D. L. Elder, D. Korn, H. Yu, J. Leuthold, L. R. Dalton, L. Alloatti, M. Woessner, M. Lauermann, P. C. Schindler. Femtojoule electro-optic modulation using a silicon-organic hybrid device. Light Sci. Appl., 4, e255(2015).
[13] M. Liu, X. B. Yin, A. E. Ulin, B. S. Geng, T. Zentgraf, L. Ju, F. Wang, X. Zhang. A graphene-based broadband optical modulator. Nature, 474, 64-67(2011).
[14] S. Y. Luo, Y. N. Wang, T. Xin, Z. M. Wang. Graphene-based optical modulators. Nano. Res. Lett., 10, 199(2015).
[15] T. C. Wang, X. D. Zhang. Improved third-order nonlinear effect in graphene based on bound states in the continuum. Photon. Res., 5, 629-639(2017).
[16] Q. Sun, X. Sun, W. Jia, Z. Xu, H. Luo, D. Liu, L. Zhang. Graphene-assisted microfiber for optical-power-based temperature sensor. IEEE Photon. Technol. Lett., 28, 383-386(2016).
[17] S. R. Bongu, P. B. Bisht, R. C. K. Namboodiri, P. Nayak, S. Ramaprabhu, T. J. Kelly, C. Fallon, J. T. Costello. Influence of localized surface plasmons on Pauli blocking and optical limiting in graphene under femtosecond pumping. J. Appl. Phys., 116, 073101(2014).
[18] C. Y. Zhao, D. Mao, J. L. Zhao, L. Han, L. Fang, X. T. Gan, Y. D. Wang. Graphene-assisted all-fiber phase shifter and switching. Optica, 2, 468-471(2015).
[19] J. Kang, B. L. Lu, X. Y. Qi, X. Q. Feng, H. W. Chen, M. Jiang, Y. Wang, P. Fu, J. T. Bai. An efficient single-frequency Yb-doped All-fiber MOPA laser at 1064.3 nm. Chin. Phys. Lett., 33, 54-57(2016).
[20] M. Qi, Z. Y. Ren, Y. Jiao, Y. X. Zhou, X. L. Xu, W. L. Li, J. Y. Li, X. L. Zheng, J. T. Bai. Hydrogen kinetics on scalable graphene growth by atmospheric pressure chemical vapor deposition with acetylene. J. Phys. Chem. C, 117, 14348-14353(2013).
[21] R. W. Boyd. Nonlinear Optics(2009).
[22] G. P. Agrawal. Nonlinear Fiber Optics(2005).
[23] A. Kobyakov, M. Sauer, D. Chowdhury. Stimulated Brillouin scattering in optical fibers. Adv. Opt. Photon., 2, 1-59(2010).
[24] B. Zhou, C. Shu, L. Wang, S. He. Stimulated Brillouin scattering slow-light-based fiber-optic temperature sensor. Opt. Lett., 36, 427-429(2011).
[25] M. Dinu, F. Quochi, H. Garcia. Third-order nonlinearities in silicon at telecom wavelengths. Appl. Phys. Lett., 82, 2954-2956(2003).
[26] J. L. Cheng, N. Vermeulen, J. E. Sipe. Third order optical nonlinearity of graphene. New J. Phys., 16, 053014(2014).
[27] R. E. Newnham, V. Sundar, R. Yimnirun, J. Su, Q. M. Zhang. Electrostriction: nonlinear electromechanical coupling in solid dielectrics. J. Phys. Chem. B, 101, 10141-10150(1997).
[28] A. Yeniay, J. Delavaux, J. Toulouse. Spontaneous and stimulated Brillouin scattering gain spectra in optical fibers. J. Lightwave Technol., 20, 1425-1432(2002).
[29] P. Dainese, P. St.J. Russell, N. Joly, J. C. Knight, G. S. Wiederhecker, H. L. Fragnito, V. Laude, A. Khelif. Stimulated Brillouin scattering from multi-GHz-guided acoustic phonons in nanostructured photonic crystal fibres. Nat. Phys., 2, 388-392(2006).
[30] R. Pant, C. G. Poulton, D. Y. Choi, H. Mcfarlane, S. Hile, E. Li, L. Thevenaz, B. Luther-Davies, S. J. Madden, B. J. Eggleton. On-chip stimulated Brillouin scattering. Opt. Fiber Technol., 19, 8285-8290(2011).
[31] E. Lichtman, A. A. Friesem. Stimulated Brillouin scattering excited by a multimode laser in single-mode optical fibers. Opt. Commun., 64, 544-548(1987).


