• Chinese Journal of Lasers
  • Vol. 49, Issue 23, 2304005 (2022)
Peng Gong and Jianqi Shen*
Author Affiliations
  • College of Science, University of Shanghai for Science and Technology, Shanghai 200093, China
  • show less
    DOI: 10.3788/CJL202249.2304005 Cite this Article Set citation alerts
    Peng Gong, Jianqi Shen. Measurement of Particle Velocity, Particle Size Distribution, and Particle Volume Fraction in Two-Phase Flow Using Transmission Fluctuation Correlation Spectrometry[J]. Chinese Journal of Lasers, 2022, 49(23): 2304005 Copy Citation Text show less
    Measurement principle diagram of transmission fluctuation correlation spectrometry
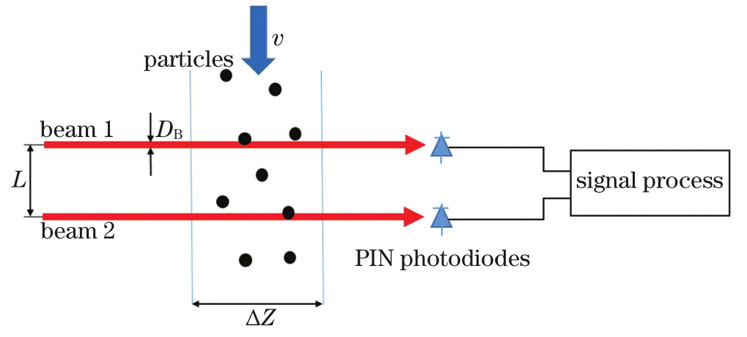
    Fig. 1. Measurement principle diagram of transmission fluctuation correlation spectrometry
    Experimental setup. (a) Schematic of experimental setup; (b) photo of experimental setup
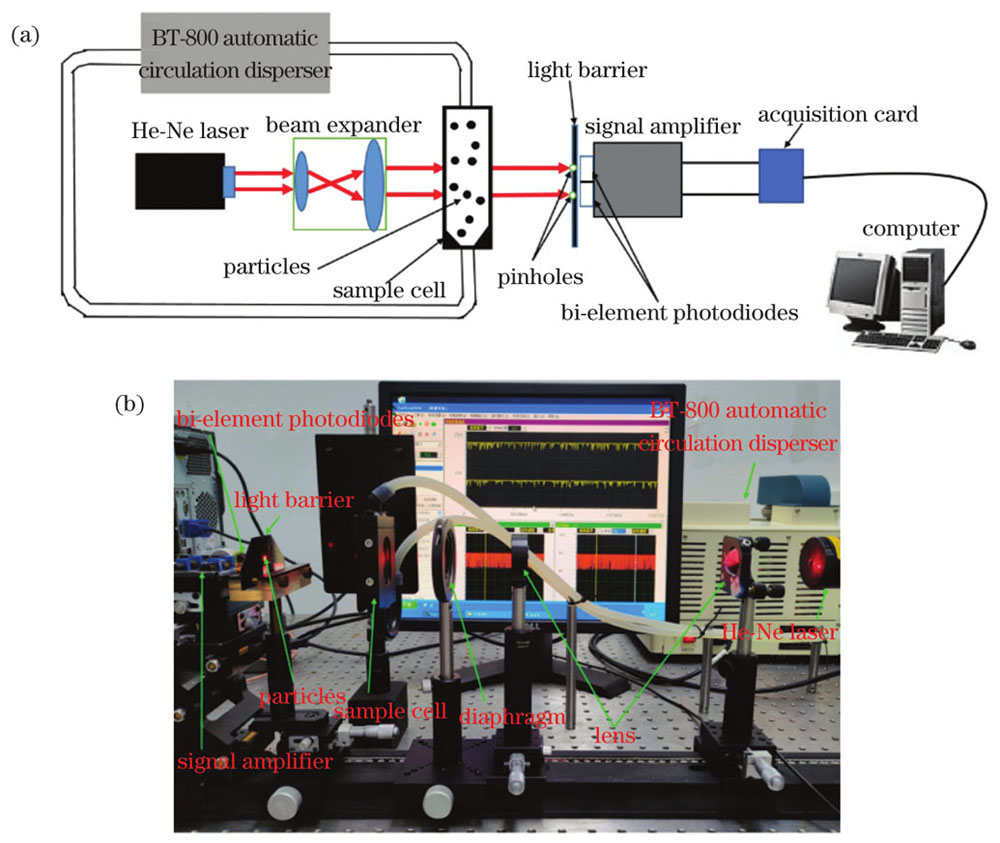
    Fig. 2. Experimental setup. (a) Schematic of experimental setup; (b) photo of experimental setup
    Correlation spectra of glass beads with nominal size of 700 μm. (a) Cross-correlation spectrum of transmission fluctuation; (b) auto-correlation spectrum of transmission fluctuation
    Fig. 3. Correlation spectra of glass beads with nominal size of 700 μm. (a) Cross-correlation spectrum of transmission fluctuation; (b) auto-correlation spectrum of transmission fluctuation
    Chart of modified Chahine iterative algorithm
    Fig. 4. Chart of modified Chahine iterative algorithm
    Inversion results of particle size distributions for variant volume fraction. (a) Glass bead with 200 μm nominal diameter; (b) glass bead with 400 μm nominal diameter; (c) glass bead with 500 μm nominal diameter; (d) glass bead with 700 μm nominal diameter; (e) silica sand with 200 μm nominal diameter; (f) white corundum with 600 μm nominal diameter
    Fig. 5. Inversion results of particle size distributions for variant volume fraction. (a) Glass bead with 200 μm nominal diameter; (b) glass bead with 400 μm nominal diameter; (c) glass bead with 500 μm nominal diameter; (d) glass bead with 700 μm nominal diameter; (e) silica sand with 200 μm nominal diameter; (f) white corundum with 600 μm nominal diameter
    Measurement results of particle volume fraction. (a) Spherical glass bead;(b) non-spherical silica sand and white corundum
    Fig. 6. Measurement results of particle volume fraction. (a) Spherical glass bead;(b) non-spherical silica sand and white corundum
    Schematic of feeding with vibration feeder and measurement
    Fig. 7. Schematic of feeding with vibration feeder and measurement
    Inversely calculated particle size cumulative distributions under the condition of feeding with vibration feeder. (a) Glass bead with 400 μm nominal diameter; (b) glass bead with 500 μm nominal diameter; (c) glass bead with 900 μm nominal diameter; (d) white corundum with 600 μm nominal diameter
    Fig. 8. Inversely calculated particle size cumulative distributions under the condition of feeding with vibration feeder. (a) Glass bead with 400 μm nominal diameter; (b) glass bead with 500 μm nominal diameter; (c) glass bead with 900 μm nominal diameter; (d) white corundum with 600 μm nominal diameter
    No.Particle velocity/(m·s-1)
    Glass bead with 200 μm nominal diameterGlass bead with 400 μm nominal diameterGlass bead with 500 μm nominal diameterGlass bead with 700 μm nominal diameterSilica sand with 200 μm nominal diameterWhite corundum with 600 μm nominal diameter
    11.2071.1671.1821.1591.1361.054
    21.1511.1591.1591.1511.1591.087
    31.1591.1441.1671.1361.1741.042
    41.1361.1441.1361.1221.1511.042
    51.1511.1361.1361.1291.1221.042
    61.1591.1291.1361.2121.1361.029
    Average value1.1611.1461.1531.1371.1471.049
    Table 1. Measurement results of particle velocity in circulating disperser
    Particlex90/μmAverage x90/μm
    Glass bead with 200 μm nominal diameter298304311346327330319
    Glass bead with 400 μm nominal diameter865835881868848869861
    Glass bead with 500 μm nominal diameter806828841870853895849
    Glass bead with 700 μm nominal diameter1006100210131014100510521015
    Silica sand with 200 μm nominal diameter314299359337333338330
    White corundum with 600 μm nominal diameter96210301033998106110371020
    Table 2. Characteristic particle size x10x50 and x90 measured with transmission fluctuation correlation spectrometry
    Particlex10/μmx50/μmx90/μm
    Glass bead with 200 μm nominal diameter131190271
    Glass bead with 400 μm nominal diameter351437543
    Glass bead with 500 μm nominal diameter434512617
    Glass bead with 700 μm nominal diameter458657899
    Silica sand with 200 μm nominal diameter119203299
    White corundum with 600 μm nominal diameter208584875
    Table 3. Characteristic particle size x10x50 and x90 measured using Bettersize2600
    No.Velocity /(m·s-1)
    Glass bead with 400 μm nominal diameterGlass bead with 500 μm nominal diameterGlass bead with 900 μm nominal diameterWhite corundum with 600 μm nominal diameter
    11.823*1.786*2.4312.692
    21.923*1.823*2.7782.652
    31.923*1.987*2.4732.734
    42.4652.4592.7342.692
    52.4652.4332.4652.652
    Table 4. Measurement results on particle velocity under the condition of feeding with vibration feeder
    Particlex10/μmx50/μmx90/μm
    Glass bead with nominal diameter of 400 μm134385816
    Glass bead with nominal diameter of 500 μm237489847
    Glass bead with nominal diameter of 900 μm4029001748
    White corundum with nominal diameter of 600 μm2285791288
    Table 5. Average characteristic particle size x10, x50 and x90 under the condition of feeding with vibration feeder
    Peng Gong, Jianqi Shen. Measurement of Particle Velocity, Particle Size Distribution, and Particle Volume Fraction in Two-Phase Flow Using Transmission Fluctuation Correlation Spectrometry[J]. Chinese Journal of Lasers, 2022, 49(23): 2304005
    Download Citation