1National Laboratory of Solid State Microstructures, Key Laboratory of Intelligent Optical Sensing and Manipulation, College of Engineering and Applied Sciences, and Collaborative Innovation Center of Advanced Microstructures, Nanjing University, Nanjing 210093, China
2Center for Quantum Science and Technology, Jiangxi Normal University, Nanchang 330022, China
3State Key Laboratory of Precision Spectroscopy, Joint Institute of Advanced Science and Technology, School of Physics and Electronic Science, East China Normal University, Shanghai 200062, China
4Collaborative Innovation Center of Extreme Optics, Shanxi University, Taiyuan 030006, China
Quantum stochastic phase estimation has many applications in the precise measurement of various physical parameters. Similar to the estimation of a constant phase, there is a standard quantum limit for stochastic phase estimation, which can be obtained with the Mach–Zehnder interferometer and coherent input state. Recently, it has been shown that the stochastic standard quantum limit can be surpassed with nonclassical resources such as squeezed light. However, practical methods to achieve quantum enhancement in the stochastic phase estimation remain largely unexplored. Here we propose a method utilizing the SU(1,1) interferometer and coherent input states to estimate a stochastic optical phase. As an example, we investigate the Ornstein–Uhlenback stochastic phase. We analyze the performance of this method for three key estimation problems: prediction, tracking, and smoothing. The results show significant reduction of the mean square error compared with the Mach–Zehnder interferometer under the same photon number flux inside the interferometers. In particular, we show that the method with the SU(1,1) interferometer can achieve fundamental quantum scaling, achieve stochastic Heisenberg scaling, and surpass the precision of the canonical measurement.
1. INTRODUCTION
Quantum optical phase estimation is a critical task in many applications such as quantum imaging [1–3], quantum sensing [4–7], and gravitational wave detection [8,9]. To date, most works have focused on the estimation of a constant phase , in which a Mach–Zehnder interferometer (MZI) is the most commonly used device [10,11]. The precision of estimation is limited by the shot noise when the classic resources are used. This limit is often called the standard quantum limit (SQL), , where is the average number of photons in the probe state [12,13]. Many efforts have been taken to improve the precision. Most of them focus on utilizing nonclassical states to reduce the quantum noise, such as the squeezed states and entanglement states [14–16]. It has been shown that the maximally entangled number state (N00N) is the optimum probe state to reach the Heisenberg limit (HL) [17,18]. Moreover, for the constant phase estimation, the variance of estimation ( or ) will decrease indefinitely as the number of measurement increases.
However, it is not enough to just estimate the constant phase because many signals of interest in the real world are time varying and stochastic [19–23]. Thus, how to estimate such a time-varying phase with high precision is of practical importance. We assume that is the phase to be estimated. It can be treated as a constant in if the is small enough, i.e., , so the phase can be discretized as . There is a set of observations used to estimate the , where is the observation at time . Compared to the estimation of constant phase, between the phases at two different times increases as increases. Therefore, the correlation between and decreases as increases, and the number of observations that can be used to improve precision is limited. So there is a limited precision for the stochastic phase estimation, even for infinite measurement time. The mean square error (MSE) in the estimation of a stationary Gaussian stochastic phase with a power-law spectrum using coherent states scales as , which is called stochastic SQL. Here is the photon flux [24–26]. Similar to constant phase estimation, there is a stochastic Heisenberg scaling for the estimation of this stochastic phase, which scales as [24–26]. Previous works show that the stochastic SQL can be surpassed with nonclassical resources such as the squeezed light with an adaptive quantum smoothing technique or canonical phase measurement [27–32]. However, practical methods to achieve quantum enhancement in the stochastic phase estimation still remain largely unexplored.
In this paper, we propose a method to estimate the stochastic phase using a new measurement device, the SU(1,1) interferometer. Such device, also known as the nonlinear interferometer (NLI), was original proposed by Yurke and experimentally demonstrated with a signal-to-noise ratio (SNR) surpassing that of the MZI [33–43]. By combining the NLI with adaptive feedback technique, we show that MSE of the estimation is reduced over a range of parametric amplifier gain compared to that of MZI. For a fixed photon flux, there is an optimal that minimizes the MSE and maximizes the precision. In particular, with the optimal , the precision of our scheme surpasses the stochastic SQL and achieves stochastic Heisenberg scaling asymptotically.
Sign up for Photonics Research TOC. Get the latest issue of Photonics Research delivered right to you!Sign up now
2. STOCHASTIC PHASE ESTIMATION SCHEME
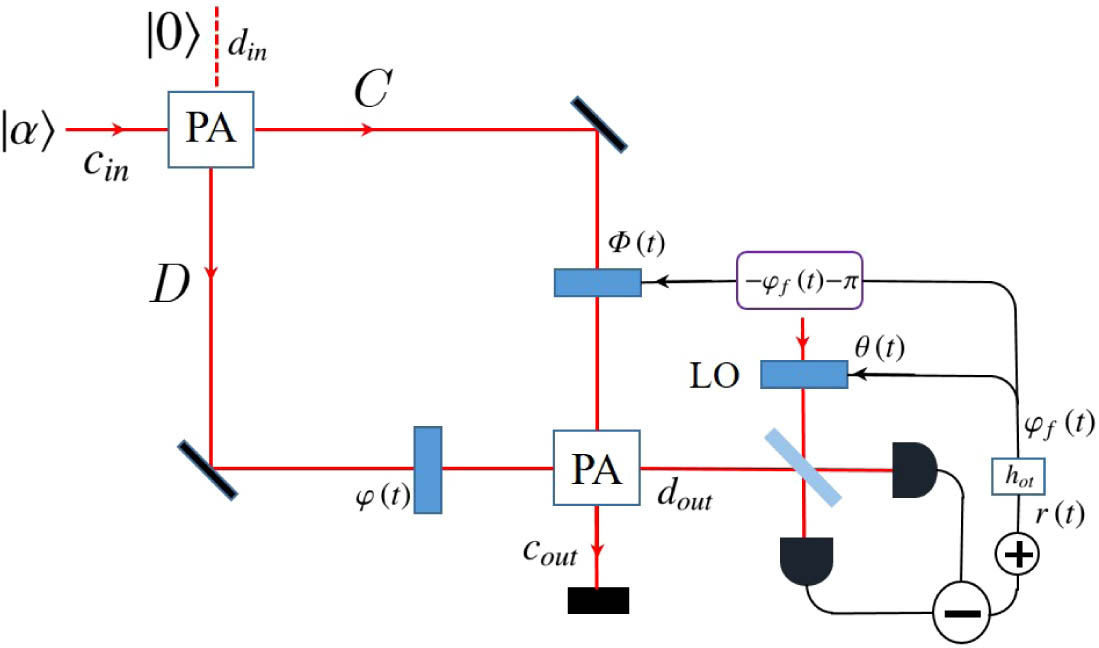
The schematic diagram of the estimation of a stochastic phase with NLI is shown in Fig. 1, in which the NLI contains two parametric amplifiers (PAs). Two input modes of the first PA are injected with a coherent state and a vacuum state. The phase to be estimated is imposed to one arm of the interferometer. One of the output modes is measured with the homodyne measurement. The measured results after a displaced operation yield photocurrent . The phase in the other arm and the phase of the local oscillator are adaptively controlled based on , which is estimated from for all the regions . In the NLI, the first PA plays the role of beam splitting. If we define to be the annihilation operators of the two inputs and to be the annihilation operators of the outputs, the relation of the input/output of the PA can be written as , , where the gain of the PA can also be parametrized by hyperbolic functions [44,45] and [36]. The second PA, which has the same gain , plays the role of recombination, so the complete input/output relation of the NLI is
Figure 1.Schematic diagram of enhanced stochastic phase estimation with an SU(1,1) interferometer. This interferometer consists of two parametric amplifiers (PAs), and the input states are the coherent state and the vacuum state. is the stochastic phase to be estimated, and the phase in the other arm is adaptively controlled. is photocurrent, which is equal to the homodyne measurement results after an added operation. The phase of the local oscillator is adaptively controlled simultaneously, and is the optimum linear processor of phase tracking.
When we perform a homodyne detection at the output mode , and the homodyne detection result is added by , the photocurrent can be approximately represented as (Appendix A) Here we have adaptively controlled the feedback phase and the phase of the local oscillator to be , . This adjustment makes each measurement most sensitive and maximizes the phase information obtained. is the normalized Gaussian white noise from the homodyne measurement, which satisfies . Moreover, the photocurrent has Gaussian stationary statistics, and is stationary MSE. We have defined the photon flux in the interferometer to be .
According to the time span of the observations in the estimation, the time-varying phase estimation can be divided into three cases. Prediction: the future phase is estimated with observations . Tracking: the current and previous observations are used to estimate the current phase . Smoothing: the measurement results beyond the time are also used to estimate phase . To analyze these three estimation problems simultaneously, we introduce a general desired signal , which is estimated with photocurrent . Here can be any real number, and the three kinds of phase estimation can be defined according to the value of . Based on the measurement photocurrent , the desired signal can be estimated as where is the impulse response function, which represents the output at time if the input at time is an impulse, and it can be marked as for prediction, tracking, and smoothing, respectively. The optimum linear processor for minimizing the MSE satisfies [46] which is the Wiener–Hopf equation and , . The correlation function only depends on the time difference due to the fact that received photocurrent and desired signal are jointly stationary and time invariant. We can obtain the optimum linear impulse response function by solving the Wiener–Hopf equation, and the MSE of the phase estimation can be calculated at the same time.
In the MZI case, the splitting and recombination of light are accomplished by 50:50 beam splitters (BSs). The relation of the input/output of the beam splitter is and . Similar to NLI, we set the two feedback phases and for the most sensitive estimation. The photocurrent can be calculated as (Appendix A). Here we should note that the two input modes of the first BS are injected with a coherent state and a vacuum state, which makes the photon number flux inside both interferometers the same. From the two photocurrents, we can derive the relation , where and are the SNRs of these two interferometers, respectively. Figure 2 shows the ratio of the two SNRs (blue surface). As increases from 1, the SNR of the NLI increases with , which agrees with the previous analysis of NLI [36]. Moreover, the two parameters in the relation of the input/output of the PA are asymmetric. If the gain is close to 1, for the fixed photon flux , the part of signal of Eq. (2) is close to zero and the SNR of the NLI is smaller than that of the MZI. When exceeds a certain threshold, the SNR of the NLI surpasses that of the MZI. For finite , the further increase of will reduce the SNR. This result can be understood from Eq. (2): when is large, the signal term increases linearly with while the noise term increases quadratically with . Since the MSE in the estimation of time-varying phase cannot be arbitrarily small, we expect there is an optimal for stochastic phase estimation, which is different from the case of measuring a constantphase.
Figure 2.Ratio of the two SNRs. The blue surface represents the ratio of the two SNRs. The red surface represents the case in which the two interferometers have equal SNR.
As an example, we consider the situation that the time-varying phase to be estimated follows an Ornstein–Uhlenback stochastic process, which can be found in many practical physical processes and is defined by [31] Here is the correlation time of . represents the Wiener process, which satisfies . is the magnitude of the Wiener noise. The expectation value of is 0 and its statistics are stationary, which means the correlation between the phases at two different times only depends on their time difference. Moreover, the spectral density spectrum of is . In this situation, Eq. (4) can be solved with the Wiener technique, and the Fourier transform of the optimum linear response function is (Appendix B) where , , and . Equation (6) shows that the optimum linear processor is a low-pass filter with a cutoff frequency of in the case of . When this optimum linear processor is used to estimate the phase, the minimum MSE of the estimation is (Appendix C) where The stochastic phase is stationary and the optimum filter is time invariant, so the minimum MSE is a constant. To calculate the MSE analytically, we divide the discussion into three cases according to the value of : (i) , (ii) , and (iii) . When , . This is the phase-tracking case, and . The integral result of Eq. (7) is still implicit because is a function of . After solving the implicit result, the minimum MSE of tracking is (Appendix C) Similarly, the MSEs of the other two cases can be calculated as (Appendix C) where stands for the prediction of the future phase with current measurement outcomes and is the case of smoothing. Before investigating the enhancement of phase estimation with NLI, we set the precision of the Ornstein–Uhlenback stochastic phase estimation with a coherent state and the MZI as the classical limit. To compare the MSEs of the two types of interferometers, we make the photon number flux inside them equivalent, i.e., . In this case the MSE of phase estimation with the MZI can be written as (Appendix C) where . To investigate the effect of the gain on the MSE , we consider the stochastic phase tracking with a fixed photon number flux , , and , and we vary from 1.1 to 50. Figure 3 shows that the MSE can be reduced using the NLI compared to the classical limit with MZI. There is an optimal that gives the minimum MSE. For the feasible gain with current techniques [47], we can already obtain improvement in the MSE of phase tracking. This is expected from the analysis of the SNR. Here the optimal degree of gain depends on the photon number flux , , and .
Figure 3.MSE of tracking as a function of for MZI (red line) and NLI (blue line). Here we take , , and .
Figure 4 shows the MSE as a function of according to Eqs. (9)–(11), where the horizontal axis is the ratio between and the correlation time of . Here we have set the parameters , , , and . We can conclude three key implications from Fig. 4. First, the MSE becomes large with the increase of , and the smallest error is achieved with the smoothing. When is close to the correlation time, the MSEs tend to be the mean square variation of the stochastic phase , i.e., we cannot predict the phase away from coherence time. Second, the MSE of phase estimation with tracking is nearly two times of smoothing for both kinds of interferometers. Third, the MSEs of all cases are reduced significantly below the classical limit (red line in Fig. 4) when we use the NLI.
Figure 4.MSE as a function of for MZI (red line) and NLI (blue line). The horizontal axis is the proportion between and the correlation time of . The proportion equal to 0 represents phase tracking (black dotted line). and stand for prediction and smoothing, respectively. Here we make , , , and .
So far we have shown that the stochastic phase estimation can be enhanced with NLI. In the following, we will demonstrate that the NLI achieves the Heisenberg scaling asymptotically. For a fixed photon flux , the SNR of the measurement photocurrent Eq. (2) is . There is an optimal degree gain maximizing the SNR, and the minimum MSE of phase tracking can be calculated as . When , , , and , the optimal gain meets the relationship and we can obtain the tracking MSE (Appendix D) Substituting this expression into Eq. (10) yields the MSE of smoothing which means the MSE of stochastic phase estimation with NLI can achieve the stochastic HL scaling [24–26]. Figure 5 shows the optimal smoothing MSE in the two kinds of interferometers and canonical measurement for different mean photon flux, which varies from to . It can be seen that the phase estimation with NLI has an enhancement on scaling compared with the classical limit using MZI, and the smoothing MSE can reach the stochastic Heisenberg scaling [25]. Moreover, using the NLI we can surpass the minimum MSE of canonical measurement, which is [24]. It is worth noting that the MSE of tracking is nearly two times of smoothing for both interferometers. Therefore, the phase tracking can also reach the stochastic Heisenberg scaling. However, the MSE of stochastic phase prediction increases with the increase of , and we cannot predict the phase away from coherence time. So the prediction cannot reach the stochastic Heisenberg scaling when is relatively large.
Figure 5.Optimal smoothing MSE as a function of photon number flux for MZI (red line), NLI (blue line), and canonical measurement (black line). Here we take and .
In summary, we have proposed the stochastic optical phase estimation with an SU(1,1) interferometer. We find that a suitable range of parametric amplification gain can enhance the estimation, and there is an optimal gain minimizing the MSE, which is different from the estimation of constant phase [34,36]. Moreover, compared with the classical limit with MZI, the MSEs have significant reduction for prediction, tracking, and smoothing simultaneously under the same photon number flux inside the interferometers if we optimize the parametric amplifier gain. At last, we can achieve the stochastic Heisenberg scaling and surpass the minimum MSE by using the canonical measurement. These results highlight the advantages of the SU(1,1) interferometer in stochastic optical phase estimation and provide a new avenue for practical quantum metrology.
APPENDIX A. THE CALCULATION OF PHOTOCURRENT
When we perform homodyne detection at the output , the measurement operator can be described as where is the phase of the local oscillator. If two input modes of the first PA are injected with a coherent state and a vacuum state, the mean value of homodyne measurement is and the variance is The photocurrent that we are interested in is where we have adaptively controlled the feedback phase in the other arm as , and the phase of the local oscillator was controlled as . is a Gaussian white-noise term. Here the photocurrent has Gaussian stationary statistic, and is stationary MSE. When the photocurrent is added by , the photocurrent can be approximately represented as where we have defined that the photon flux inside the interferometer is .
In the MZI case, the splitting and recombining of light are accomplished by 50:50 beam splitters. The relation of the input/output of the beam splitter is and . The complete input/output relation of the MZI is Similar to the NLI, two input modes of the first BS are injected with a coherent state and a vacuum state, and the mean value of homodyne measurement is and the variance is The homodyne photocurrent is Here the two feedback phases are . When the photocurrent is added by , the photocurrent can be approximately represented as
APPENDIX B. SOLUTION OF THE WIENER–HOPF EQUATION
When we set and , the Wiener–Hopf equation became Here we solve the equation with two steps. The first step of solving this equation is that we suppose there is a whitening filter impulse response , which can transfer to white process , and the filtering process can be described as Taking the inverse Fourier transform on both sides, we can obtain where is the transfer function of impulse response and is the spectrum density of . According to the Eq.?(2) in the main text, we can calculate spectrum density as When we set , , , and , the spectrum density can be decomposed as . In this step, we can see that the transfer function that transfers to white process is .
In the second step, we suppose that is the impulse response of the optimum linear filter for estimating with , so the corresponding Wiener–Hopf equation is Because is a white process, therefore , and it can be found as If we take the inverse Fourier transform on both sides, we get where . Here we use the subscript , which denotes that the integration time of the inverse transform from 0 to . In this step, we can see that the transfer function of optimum linear filter for estimating with is After the two steps, we can see that the complete optimum linear processor in the frequency domain is On the other hand, there is correlation and . So To find , we take the inverse Fourier transform where is the Heaviside function. When , and so the complete optimum linear processor of phase tracking in the frequency domain is When , So the complete optimum linear processor of smoothing in the frequency domain is When , so the complete optimum linear processor of prediction in the frequency domain is Similarly, for the MZI case, the complete optimum linear processor in the frequency domain is where we set .
APPENDIX C. THE CALCULATION OF MINIMUM MEAN SQUARE ERROR
In this paper, the phase to be estimated is stationary and the optimum filter is time-invariant, so the MSE is time independent and can be calculated as In the third line we let , and we substitute with the inverse transform of in the last line. Moreover, from Eq.?(B8) we can see . So the MSEcan be expressed as where , and can be found from Eq.?(B12). When , there is filtering with zero delay, which is the phase tracking case. The integral result is which is still implicit because is a function of . After solving the implicit result, the MSE of phase tracking is When , there is filtering with prediction, and the MSE of the prediction is When , it is the case of smoothing. The MSE of smoothing is For the MZI case, we set , , , , and we use the same calculation method as for the NLI. The MSE of phase estimation with MZI can be written as
APPENDIX D. THE STOCHASTIC HEISENBERG LIMIT WITH NLI
The signal-to-noise ratio of the photocurrent Eq.?(2) in the main text is The optimal gain that minimizes the MSE of estimation is equal to that maximizes the signal-to-noise ratio. Taking the derivative of both sides of the equation with respect to , and letting the derivative be 0, we can obtain The approximate equals sign is true in the case of . Then it is combined with Eq.?(9) in the main text, and we can obtain When , it can transform to After the calculation, the optimal gain is Substituting it into Eq.?(D2), we can obtain the tracking MSE