Abstract
Photoacoustic (PA) microscopy comes with high potential for human skin imaging, since it allows noninvasively high-resolution imaging of the natural hemoglobin at depths of several millimeters. Here, we developed a PA microscopy to achieve high-resolution, high-contrast, and large field of view imaging of skin. A three-dimensional (3D) depth-coding technology was used to encode the depth information in PA images, which is very intuitive for identifying the depth of blood vessels in a two-dimensional image, and the vascular structure can be analyzed at different depths. Imaging results demonstrate that the 3D depth-coded PA microscopy should be translated from the bench to the bedside.As a new noninvasive imaging technology, photoacoustic (PA) imaging has attracted numerous attention[1–5]. PA imaging combines the high resolution of optical imaging with the high penetration depth of ultrasound imaging[6–9]. By focusing the incident laser, a spot laser is used to stimulate the biological tissues to generate the broadband frequency ultrasonic signals, and these ultrasonic signals are then used to reconstruct the optical absorption images. Scattering of ultrasonic in tissues is far less than the scattering of light, and thus, PA microscopy can achieve high-resolution imaging in the millimeter depth. Due to the high-resolution imaging ability in microvascular morphology and function in vivo, PA microscopy has become an important imaging tool in the study of microcirculation[10], tumor angiogenesis[11], port wine stain (PWS)[12], and other vascular complications[13]. However, most existing PA microscopy setups are insufficient for clinical requirements in dermatology, given its limited two-dimensional information and small field of view, which is not suitable to be applied in the visualization of human skin morphological features. The large scanning range can be used to obtain enough information about skin structure and pathological parameters, which is very important for the diagnosis and treatment of skin diseases, such as PWS and hemangiomas. Therefore, the development of a large field of view and three-dimensional (3D) depth-coded PA imaging technology is particularly meaningful for the clinical practice.
In this study, we presented 3D depth-coded PA microscopy that can scan centimeter-scale (maximum range ) by using a linear scanning mechanism and a compact optical–acoustic confocal probe. Although the previously reported PA microscopy systems have good performance in large field of view and resolution, most of them are applied to animal model detection[14,15]. Here, we extend the application of PA microscopy to the detection of human skin and use depth-coding technology to encode the depth information of the vascular network under human skin for the first time, to the best of our knowledge. Depth-coded PA imaging intuitively reveals the vascular depth and growth direction of subcutaneous blood vessels, which is of great significance for the diagnosis of skin diseases. PA microscopy adopts the optical–acoustic coaxial confocal structure, which effectively improves the detection efficiency and maximizes the signal-to-noise ratio (SNR). Besides, large-area imaging can be carried out by the linear scanning mode. A 3D depth-coding technology was developed to obtain structure information of human skin, which can more intuitively reflect the depth and volume of blood vessels in different skin layers. By using a user-defined LabVIEW (National Instruments) and MATLAB (MathWorks, Inc.) program, the PA signals arriving at the ultrasound transducer at different times are encoded into different colors. Thus, more intuitive structural information at different depths can be obtained.
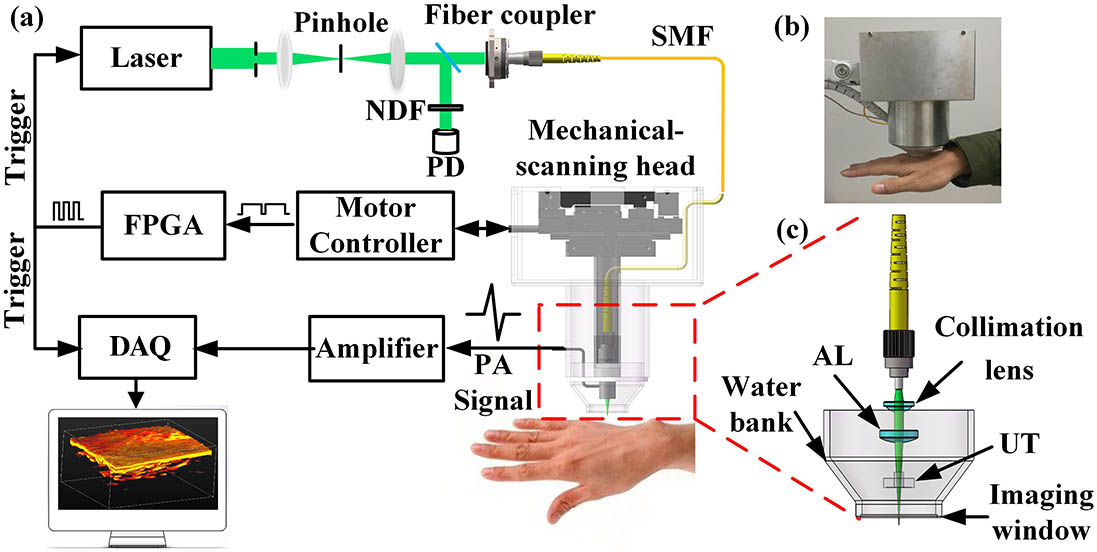
The schematic of the PA microscopy is shown in Fig. 1(a). A compact 532 nm laser (Model DTL-314QT, Pulsed -switched Lasers, Russia) with a duration of 10 ns and a repetition rate of 10 kHz was used as the light source to excite the PA signal. The laser was split into two beams by a beam splitter (GCC-401101, Daheng Optics Ltd.). A photodiode (PD818-BB-21, Newport Corp.) was employed to calibrate the intensity of the laser beam. The transmission beam was collimated by an optical spatial filter system (KT310/M, Thorlabs Inc.) and then coupled into a single-mode fiber with the help of a fiber coupler (PAF-X-7-A, Thorlabs Inc.). Figure 1(b) is a photo of the large-field mechanical scan head. The scanning head is divided into two parts: one is a moving part, which contains a two-dimensional scanner (GJD-27L30 K, Xin Wang Hong Pml Precision Mechanism Ltd, Xiamen, Fujian, China), a collimator lens (F240FC-532, Thorlabs Inc.), an aspheric lens (AL1225 H, Thorlabs Inc.), and a home-made hollow bowl ultrasonic transducer, which was made of polyvinylidene fluoride (PVDF) elements (the thickness is 9 μm, and the diameter is 6 mm) with a 3 mm center hole for the exit of the laser beam. The other is a fixed part, including a metal shell connecting the mechanical arm and a PA signal coupling cup. Figure 1(c) shows the structure of the internal core component in Fig. 1(b). The detected PA signals were amplified by a 50 dB low-noise amplifier (LNA-650, RFBAY) and then were collected by a data acquisition card (M3i.4120, SPECTRUM, and 250 MHz sampling frequency). Acquired data was recorded and reconstructed in real time by a LabVIEW program.
Sign up for Chinese Optics Letters TOC. Get the latest issue of Chinese Optics Letters delivered right to you!Sign up now

Figure 1.Schematic of the 3D depth-coded PA microscopy. (a) Schematic of the imaging system. (b) A photo of a large-field mechanical scanning head. (c) The structure of the internal core component in (b). SMF, single-mode fiber; NDF, neutral density filter; PD, photodiode; DAQ, data acquisition; AL, aspheric lens; UT, ultrasonic transducer; FPGA, field programmable gate array.
In the PA microscopy, the characteristics of the ultrasonic transducer are a key factor that decides the accuracy of the image reconstruction. To test the characteristics of the ultrasonic transducer, the transducer was driven by a pulser/receiver (5073PR, Olympus) to emit and receive the ultrasound pulses. Figure 2(a) is a normalized echo signal of the ultrasound transducer at the focus. The amplitude frequency response of the ultrasound transducer is shown in Fig. 2(b). Results show that the ultrasonic transducer has a center frequency of 40 MHz and a −6 dB bandwidth of 110%. To evaluate the lateral and axial resolution of the PA microscopy, a sharp blade edge and a carbon fiber (the diameter is about 7 μm) were imaged, respectively[16,17]. As shown in Figs. 2(c) and 2(d), the lateral resolution was calculated to be 5 μm. The axial resolution of the ultrasonic transducer was measured to be 31.2 μm, which is close to the theoretical value of 28 μm[18].
Figure 2.Resolution of the PA microscopy. (a) Pulse response of the ultrasonic transducer at the focus. (b) Amplitude frequency response of the ultrasonic transducer. (c) The lateral resolution of the PA microscopy. (d) The axial resolution of the PA microscopy.
To verify the imaging range and imaging quality of the 3D depth-coded PA microscopy, a phantom experiment was performed. During the experiment, the stage utilized a raster scanning mechanism. The fast axis motor moves continuously along the axis, while the slow axis motor moves discretely along the axis, and the speed of the fast axis motor was set to 50 mm/s, which means that the step size of the axis is 5 μm without signal averaging; the step size of the axis was also set to 5 μm to ensure high spatial sampling. In order to eliminate the effect of the nonlinearity movement in the starting and ending phases, data acquisition is only performed at the constant phase of the motor. Figure 3(a) shows the schematic of the phantom experiment. The leaf vein was obliquely inserted into a tissue mimicking phantom with a given optical absorption coefficient of and a scattering coefficient of by mixing agarose, intralipid, and India ink[1]. Figure 3(b) is the maximum intensity projection (MIP) PA image of the leaf vein. Figure 3(c) is the corresponding PA volumetric image. Figure 3(d) exhibits a 3D depth-coded PA image of the leaf vein, showing the depth of the leaf vein ranging from 0 to 3.6 mm. The results demonstrate that the 3D depth-coded PA microscopy has the ability to perform deep imaging with a large field of view. Compared with the traditional MIP PA image, the depth-coded PA image can provide depth information intuitively in a two-dimensional image, which will be beneficial to the practical detection application.
Figure 3.PA images of a leaf vein. (a) Schematic illustration of the experiment. (b) MIP PA image of the leaf vein. (c) Volumetric PA image of the leaf vein. (d) 3D depth-coded PA image corresponding to (c).
In order to verify the imaging capability of biological tissues, a rabbit ear was imaged in vivo. The experimental rabbit was a New Zealand white rabbit (weighing about 2 kg), whose ear hair was removed by a hair remover (Payven Depilatory China) before the experiment. During the experiment, sodium pentobarbital (30 mg/kg) was administered to keep the rabbit motionless[19]. For animal imaging, the laser exposure was about at the optical focus inside the ear tissue, which is lower than the American National Standards Institute (ANSI) laser safety limit [3,20]. All of the procedures involving animals have been approved by the South China Normal University of China. Figure 4(a) is a photo of a rabbit’s ear. The imaging area marked with a black dashed frame is . The PA volumetric vascular image of the rabbit ear processed by the volume visualization software (VolView 3.4, Kitware, Inc.) was shown in Fig. 4(b). Compared with the traditional MIP PA image and 3D depth-coded PA image, as shown in Figs. 4(c) and 4(d), we can find that depth-coded image not only reflects the network morphology of rabbit ear blood vessels, but also shows the relative depth of blood vessels. The results demonstrate that the 3D depth-coded PA microscopy has an excellent imaging capability for biological tissues, which is meaningful for the detection of skin diseases.
Figure 4.PA images of the rabbit ear. (a) Photos of the rabbit ear as well as the imaging area. (b) The PA volumetric vascular image. (c) The MIP PA image. (d) The 3D depth-coded PA image.
To further evaluate the clinical feasibility of the 3D depth-coded PA microscopy, the human opisthenar and palm were imaged. Figures 5(a) and 5(b) show the photos of a human opisthenar and palm. The imaging area with a black dashed frame is about . The PA volumetric images of the whole skin corresponding to the opisthenar and the palm are shown in Figs. 5(c) and 5(d), respectively. From the images, it can be known that the imaging depth of the palm is about 2 mm, higher than that of the opisthenar (1.5 mm). It may be that a high concentration of the melanin on the opisthenar makes the depth of penetration shallower. Figures 5(e) and 5(f) exhibit the volumetric vascular images beneath the epidermis, which was seen from top to bottom. The counterpart vascular images seen from bottom to top are displayed in Figs. 5(g) and 5(h). We can find that the number of capillaries within the palm is higher than that of the opisthenar, which is more obvious in the dynamic anatomical video of the opisthenar and the palm in the supplementary videos. The 3D depth-coded PA vascular images corresponding to Figs. 5(e) and 5(f) are shown in Figs. 5(i) and 5(j). From the depth-coded PA images, it can be seen that the distribution of blood vessels below the palm is wider than that of the opisthenar, and the change in the diameter of the blood vessels is also more pronounced than that of the opisthenar. These results show that 3D depth-coded PA images can clearly reveal the distribution and morphological characteristics of the main vessels and capillaries in the dermis of the opisthenar and palm without an injection of any contrast agent, which has important value for clinical practice.
Figure 5.PA images of human opisthenar and palm. (a), (b) Photos of the human opisthenar and palm, respectively. The insets show the corresponding imaging area. (c), (d) PA volumetric images of the opisthenar (Media 1) and palm (Media 2), respectively. (e), (f) PA volumetric vascular images of the opisthenar and palm beneath the epidermis seen from top to bottom. (g), (h) PA volumetric vascular images of the opisthenar and palm beneath the epidermis seen from bottom to top. (i), (j) The 3D depth-coded PA images of the opisthenar and palm corresponding to (e) and (f).
In order to provide more meaningful information, we developed the 3D depth-coded PA microscopy with a large imaging range. PA microscopy cannot only perform noninvasive and high-resolution imaging of biological tissues, but also provide comprehensible 3D pseudo-color PA images by the depth-coding technology. The system is expected to be applied in biomedical fields, such as tumor angiogenesis and monitoring of therapeutic process. The application of depth-coding technology can provide more intuitive depth information than volumetric imaging. Although the present system can provide high-resolution imaging with a large field of view, additional works are still needed to further mature this technique. The application of the 3D depth-coding technology in human blood vessels information coding is worse than that in animal experiments, and it should be improved on the algorithm to make the image quality better. A long-wavelength and higher repetition-rate laser will be essential to improve the imaging depth and speed[21–23]. Furthermore, the multi-wavelength laser is also an underlying need, which will enrich the applications of PA microscopy by measuring oxyhemoglobin saturation.
In conclusion, we developed 3D depth-coded PA microscopy with a large field of view for skin imaging. The microscopy is capable of noninvasively imaging the skin at millimeter depths with high contrast and high resolution. The application of 3D depth-coding technology can reveal the depth information of blood vessels while reflecting the structure of the vascular network of biological tissues. PA microscopy is promising for making clear distribution and changes of vessels for vascular diseases. In addition, it can objectify and quantify the vascular diseases and quantitatively support a cure standard of clinical therapy.
References
[1] W. Qin, W. Qi, T. Jin, H. Guo, L. Xi. Appl. Phys. Lett., 111, 263704(2017).
[2] E. Z. Zhang, J. G. Laufer, R. B. Pedley, P. C. Beard. Phys. Med. Biol., 54, 1035(2009).
[3] X. Dai, L. Xi, C. Duan, H. Yang, H. Xie, H. Jiang. Opt. Lett., 40, 2921(2015).
[4] F. Gao, X. Feng, Y. Zheng. Appl. Phys. Lett., 104, 213701(2014).
[5] M. J. Xu, P. Lei, J. Q. Feng, F. F. Liu, S. H. Yang, P. F. Zhang. Chin. Opt. Lett., 16, 031702(2018).
[6] F. Gao, L. Bai, S. Liu, R. Zhang, J. Zhang, X. Feng, Y. Zheng, Y. Zhao. Nanoscale, 9, 79(2017).
[7] L. Xi, S. R. Grobmyer, L. Wu, R. Chen, G. Zhou, L. G. Gutwein, J. Sun, W. Liao, Q. Zhou, H. Xie, H. Jiang. Opt. Express, 20, 8726(2012).
[8] Z. Xie, S. L. Chen, T. Ling, L. J. Guo, P. L. Carson, X. Wang. Opt. Express, 19, 9027(2011).
[9] X. Yang, B. Jiang, X. Song, J. Wei, Q. Luo. Opt. Express, 25, 7349(2017).
[10] X. Q. Yang, X. Cai, K. Maslov, L. H. Wang, Q. M. Luo. Chin. Opt. Lett., 8, 609(2010).
[11] Y. Wang, D. Xu, S. Yang, D. Xing. Biomed. Opt. Express, 7, 279(2016).
[12] D. Xu, S. Yang, Y. Wang, Y. Gu, D. Xing. Biomed. Opt. Express, 7, 2095(2016).
[13] W. Song, Q. Wei, R. Zhang, H. F. Zhang. Chin. Opt. Lett., 12, 051704(2014).
[14] D. Xu, S. Yang, Y. Wang, Y. Gu, D. Xing. Biomed. Opt. Express, 7, 2095(2016).
[15] A. P. Jathoul, J. Laufer, O. Ogunlade, B. Treeby, B. Cox, E. Zhang, P. Johnson, A. R. Pizzey, B. Philip, T. Marafioti, M. F. Lythgoe, R. B. Pedley, M. A. Pule, P. Beard. Nat. Photon., 9, 239(2015).
[16] B. Li, H. Qin, S. Yang, D. Xing. Opt. Express, 22, 20130(2014).
[17] J. Y. Kim, C. Lee, K. Park, G. Lim, C. Kim. Sci. Rep., 5, 7932(2015).
[18] M. Xu, L. V. Wang. Phys. Rev. E, 67, 056605(2003).
[19] J. Sun, Q. Zhou, S. Yang. Opt. Express, 26, 4967(2018).
[20] W. Song, W. Zheng, R. Liu, R. Lin, H. Huang, X. Gong, S. Yang, R. Zhang, L. Song. Biomed. Opt. Express, 5, 4235(2014).
[21] J. Yao, L. Wang, J.-M. Yang, K. I. Maslov, T. T. W. Wong, L. Li, C.-H. Huang, J. Zou, L. V. Wang. Nat. Methods, 12, 407(2015).
[22] L. Wang, J. Xia, J. Yao, K. I. Maslov, L. V. Wang. Phys. Rev. Lett., 111, 204301(2013).
[23] L. Zeng, Z. Piao, S. Huang, W. Jia, Z. Chen. Opt. Express, 23, 31026(2015).