Author Affiliations
1State Key Laboratory of Earth Surface Processes and Resource Ecology/MEM & MoE Key Laboratory of Environmental Change and Natural Hazards, Faculty of Geographical Science, Beijing Normal University, Beijing 100875, China2Key Laboratory of Land Surface Pattern and Simulation, Institute of Geographic Sciences and Resources Research, CAS, Beijing 100101, Chinashow less
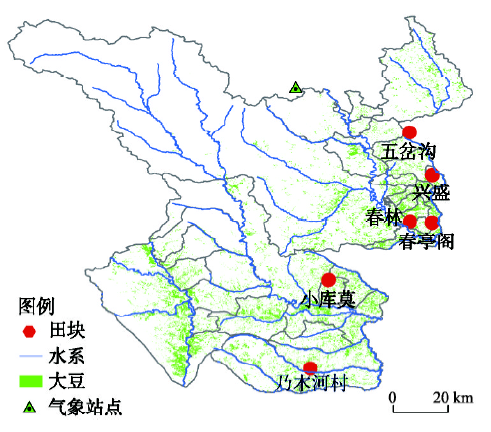
Fig. 1. Overview of the study area
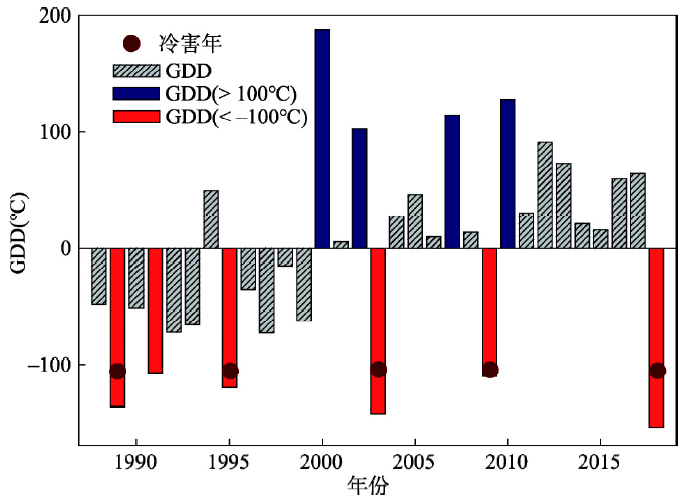
Fig. 2. The cold years in Northeast China
Fig. 3. Comparison between simulated and observed variables of soybean
Fig. 4. Daily leaf area index (LAI) outputs from 512 simulations of the CROPGRO-Soybean model
Fig. 5. The coefficient of determination for the regression models
Fig. 6. The maximum LAI and its specific observation dates of early and late growing season windows obtained from Sentinel-2 in 2018
Fig. 7. Estimated yields by calibrated CROPGRO-Soybean model under different cold injury scenarios
Fig. 8. The comparison between actual and simulated yield losses
Fig. 9. Spatial distribution of estimated yields in normal year (2017) and cold year (2018)
Fig. 10. The spatial distribution of yield losses in 2018 relative to 2017
| 基本信息 | 五岔沟 | 兴盛 | 春亭阁 | 春林 | 乃木河 | 小库莫 |
|---|
| 经度(°) | 124.42 | 124.49 | 124.49 | 124.42 | 124.11 | 124.17 | | 纬度(°) | 50.10 | 49.97 | 49.83 | 49.83 | 49.4 | 49.7 | | 高程(m) | 486 | 393 | 380 | 365 | 381 | 447 | | 品种 | 黑河38 | 黑农35 | 合丰50 | 合丰25 | 合丰39 | 黑河18 | | 熟性 | 中熟 | 中熟 | 中熟 | 中晚熟 | 中熟 | 中熟 | | 栽培方式 | 平作条播 | 条播 | 条播 | 垄作 | 条播 | 平作条播 |
|
Table 1. The basic information of six crop fields
| 年份 | 观测数据 | 五岔沟 | 兴盛 | 春亭阁 | 春林 | 乃木河 | 小库莫 |
|---|
| 2014 | 播种日期 | 5月16日 | 5月18日 | 5月1日 | 5月18日 | 5月28日 | 5月11日 | | 开花普遍期 | 7月14日 | 7月12日 | 6月30日 | 7月6日 | 7月18日 | 6月30日 | | 开花成熟期 | 9月26日 | 9月28日 | 9月18日 | 9月28日 | 9月28日 | 9月24日 | | 种植密度(株/m2) | 39.69 | 30.42 | 47.73 | 36.75 | 37.98 | 38.47 | | 产量(kg/hm2) | 1160 | 1350 | 1650 | 1150 | 610 | 1050 | | 2015 | 播种日期 | 5月16日 | 5月16日 | 5月28日 | 5月8日 | 5月17日 | 5月18日 | | 开花普遍期 | 7月16日 | 7月10日 | 7月2日 | 7月12日 | 7月16日 | 7月8日 | | 开花成熟期 | 9月16日 | 9月14日 | 9月28日 | 9月28日 | 9月28日 | 9月8日 | | 种植密度(株/m2) | 47.94 | 35.6 | 38.18 | 26.24 | 25.84 | 28.58 | | 产量(kg/hm2) | 980 | 1100 | 1410 | 1030 | 510 | 860 | | 2016 | 播种日期 | 6月6日 | 5月16日 | 5月6日 | 5月22日 | 5月18日 | 5月18日 | | 开花普遍期 | 7月20日 | 7月14日 | 6月28日 | 7月28日 | 7月2日 | 7月2日 | | 开花成熟期 | 9月30日 | 9月26日 | 9月18日 | 9月30日 | 9月18日 | 9月14日 | | 种植密度(株/m2) | 32.97 | 30.55 | 40.04 | 42.9 | 40.8 | 35.82 | | 产量(kg/hm2) | 1280 | 1450 | 1850 | 1370 | 670 | 1110 | | 2017 | 播种日期 | 5月24日 | 5月23日 | 5月21日 | 5月18日 | 5月24日 | 6月2日 | | 开花普遍期 | 7月8日 | 7月12日 | 7月22日 | 7月8日 | 7月1日 | 7月14日 | | 开花成熟期 | 9月28日 | 9月24日 | 9月22日 | 9月18日 | 9月18日 | 9月24日 | | 种植密度(株/m2) | 43.5 | 35.76 | 27.56 | 36.9 | 40.6 | 52.36 | | 产量(kg/hm2) | 1350 | 1500 | 1240 | 1500 | 750 | 1200 |
|
Table 2. The observation information of key growth period, planting density and yield of crop fields
| 参数 | 定义 | 默认值 | 五岔沟 | 兴盛 | 春亭阁 | 春林 | 乃木河 | 小库莫 |
|---|
| CSDL | 临界短日长(h) | 12.15 | 14.03 | 12.23 | 13.06 | 14.58 | 11.9 | 14.03 | | PPSEN | 生长发育光周期响应斜率(/h) | 0.2 | 0.235 | 0.294 | 0.287 | 0.229 | 0.146 | 0.304 | | EM-FL | 出苗到开花期的时间间隔(d) | 21 | 13.09 | 18.33 | 15.46 | 16.53 | 26.14 | 22.74 | | FL-SH | 第一次开花到第一次结荚时间间隔(d) | 6 | 6 | 6 | 6 | 6 | 6 | 6 | | FL-SD | 第一次开花到第一次结实时间间隔(d) | 12 | 19.82 | 21.06 | 18.42 | 18.39 | 11.26 | 12.06 | | SD-PM | 第一次播种到成熟的时间间隔(d) | 26 | 37.56 | 24.5 | 36.63 | 31.27 | 22.25 | 34.33 | | FL-LF | 第一次开花到叶片停止生长时间间隔(d) | 20 | 20 | 20 | 20 | 20 | 20 | 20 | | LFMAX | 最大叶片光合速率(mg CO2/(m2 s)) | 1.03 | 1.023 | 1.052 | 1.034 | 1.011 | 1.196 | 1.257 | | SLAVR | 在标准生长条件下, 品种比叶面积(cm2/g) | 385 | 311.2 | 303.8 | 301 | 317.6 | 337.9 | 301.1 | | SIZLF | 整个复叶的最大叶面积(cm2) | 137 | 138.1 | 145.1 | 138 | 141.2 | 188.5 | 217.6 | | XFRT | 每日生长中分配给种子和外壳最大比例 | 1 | 1 | 1 | 1 | 1 | 1 | 1 | | WTPSD | 单粒种子的最大重量(g) | 0.155 | 0.162 | 0.157 | 0.161 | 0.181 | 0.195 | 0.186 | | SFDUR | 所有荚内籽粒灌浆持续天数(d) | 22 | 25.42 | 24.88 | 24.22 | 25.36 | 21.62 | 21.94 | | SDPDV | 标准生长条件下每荚平均粒数(荚数) | 2.2 | 2.415 | 2.276 | 2.09 | 2.24 | 2.397 | 1.794 | | PODUR | 最佳生长条件下, 到结痂期持续天数(d) | 13 | 13 | 13 | 13 | 13 | 13 | 13 |
|
Table 3. CROPGRO-Soybean model parameters and the genetic coefficients of crop fields
| 乡镇名 | 减产率(%) | 乡镇名 | 减产率(%) | 乡镇名 | 减产率(%) |
|---|
| 卡日楚村 | 21.23 | 卧北村 | 29.77 | 向阳村 | 24.35 | | 岭南村 | 14.64 | 扎西村 | 19.54 | 乌尔其村 | 31.14 | | 讷尔克气村 | 22.61 | 五岔沟村 | 15.86 | 朝阳猎民村 | 21.19 | | 青松沟村 | 24.52 | 乃木河村 | 25.15 | 十六栋房村 | 32.28 | | 团结村 | 19.38 | 马尾山村 | 18.34 | 诺敏河村 | 6.54 | | 渔场村 | 8.76 | 库维地村 | 22.58 | 小二红村 | 18.08 | | 新兴村 | 9.55 | 跃进村 | 28.83 | 龙头村 | 29.25 | | 欧肯河村 | 18.24 | 奎勒河村 | 5.29 | 新丰村 | 20.63 | | 兴盛村 | 28.04 | 东升村 | 21.52 | 卧罗河村 | 30.79 | | 二十里村 | -29.94 | 小库莫村 | 17.63 | 铁东村 | 30.05 | | 乌鲁布铁猎民村 | 9.53 | 都柿沟村 | 21.30 | 大库莫村 | 21.58 | | 红旗村 | 22.65 | 朝阳沟村 | 22.67 | 二根河村 | 7.97 | | 马鞍山村 | 18.52 | 新发村 | 26.92 | 东升村 | 21.52 | | 春林村 | 26.02 | 春亭阁村 | 16.09 | 毛家铺村 | 18.77 |
|
Table 4. The estimated yield losses of soybean at village level