
Hao LIU, Tianqi ZHAO, Chunlian ZHAN, Yanxia ZOU, Shangzhong JIN. Research on High Precision Vacuum Ultraviolet Spectroradiometer Technology[J]. Optoelectronic Technology, 2023, 43(3): 269
- Optoelectronic Technology
- Vol. 43, Issue 3, 269 (2023)
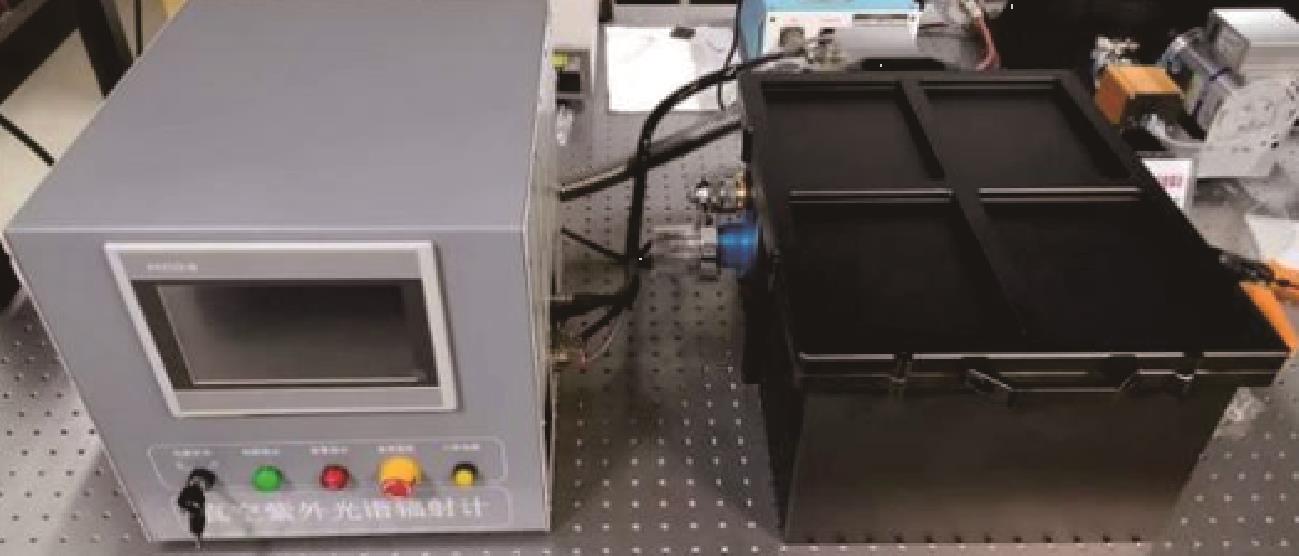
Fig. 1. Outline diagram of vacuum ultraviolet spectroradiometer
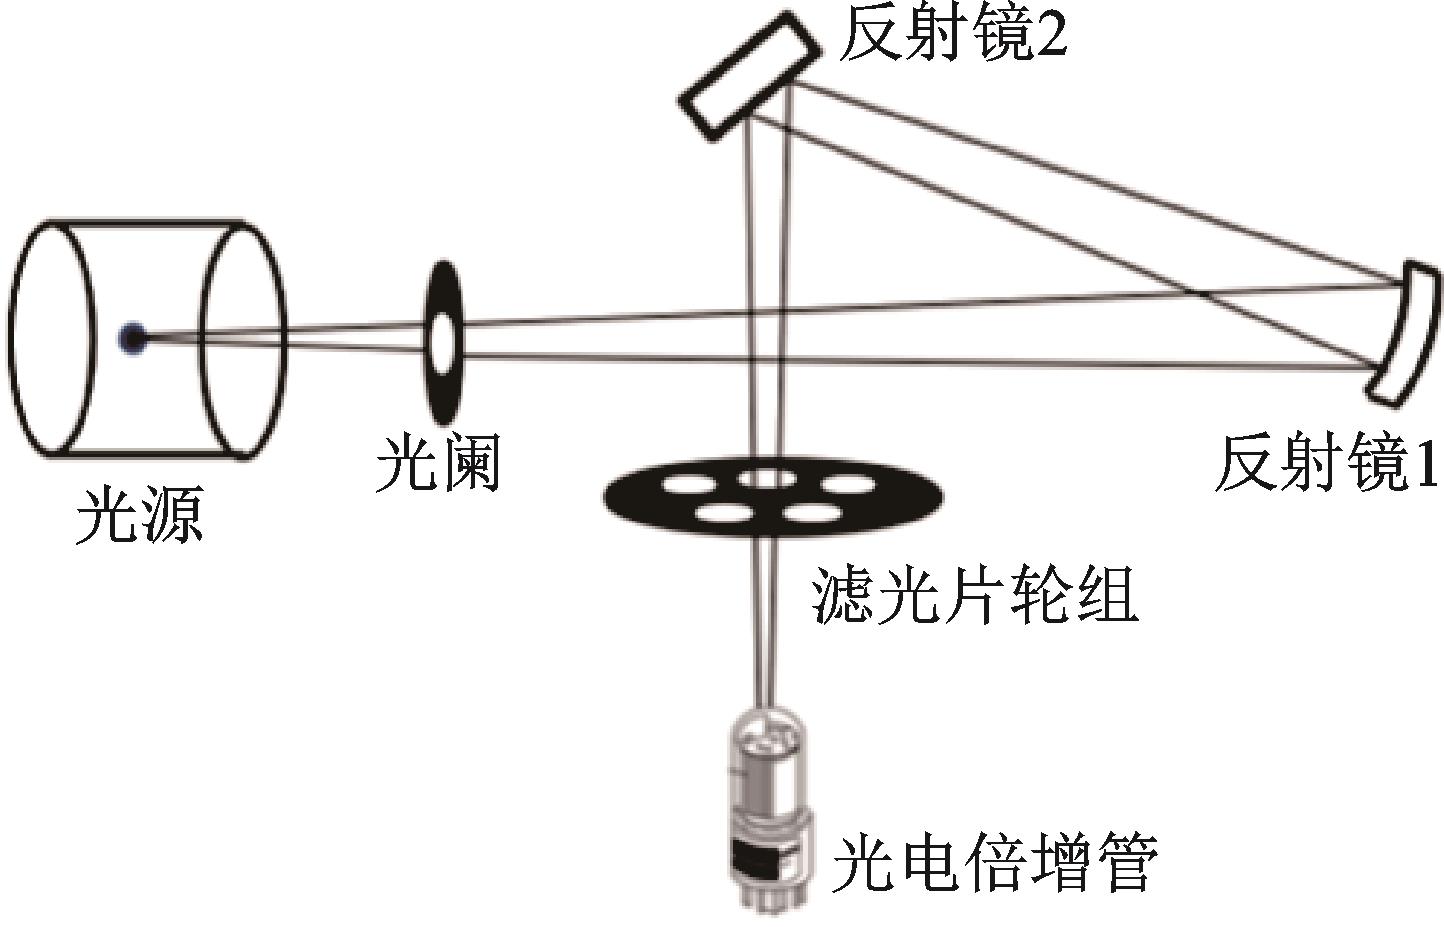
Fig. 2. Off‑axis aspherical double reflection ultraviolet optical system
Fig. 3. Performance test of vacuum ultraviolet filter
Fig. 4. Reflectivity of the mirror at incident angles of 15 ° and 45 °
Fig. 5. Simulation curves of influence of MgF2 protective layer thickness on aluminum mirror reflectivity
Fig. 6. Internal structure diagram of MCP-PMT
Fig. 7. Dark current curve of MCP-PMT over time
Fig. 8. Dark current graph as a function of vacuum
Fig. 9. Curve chart of signal to noise ratio as a function of bias voltage
Fig. 10. Photocathode sensitivity curves
Fig. 11. Photo of vacuum chamber
Fig. 12. Simulation nephogram of static displacement and stress of vacuum chamber
Fig. 13. Simulation nephogram of stress and static displacement of upper cover of cabin
Fig. 14. Chart of spectral radiance test result
Fig. 15. Responsiveness curve near the center wavelength of 121.2 nm
Fig. 16. Responsiveness curve near the center wavelength of 135.6 nm
Fig. 17. Responsiveness curve near the center wavelength of 160 nm
Fig. 18. Responsiveness curve near the center wavelength of 180 nm
Fig. 19. Responsiveness curve near the center wavelength of 200 nm
Fig. 20. Spectroradiometer working wavelength signal-to-noise ratio curve

Set citation alerts for the article
Please enter your email address
© Copyright 2018-2021 | Chinese Laser Press. All Rights Reserved 沪ICP备15018463号-20