• Acta Physica Sinica
  • Vol. 69, Issue 18, 189201-1 (2020)
Guo-Ying Tang1、2, Zhu-Ling Sun2、*, Ru-Bin Jiang2, Feng-Quan Li2、3, Ming-Yuan Liu2、3, Kun Liu1, and Xiu-Shu Qie2、3
Author Affiliations
  • 1College of Electronic Engineering (College of Meteorological Observation), Chengdu University of Information Technology, Chengdu 610225, China
  • 2Key Laboratory of Middle Atmosphere and Global Environment Observation, Institute of Atmospheric Physics, Chinese Academy of Sciences, Beijing 100029, China
  • 3College of Earth and Planetary Sciences, University of Chinese Academy of Sciences, Beijing 100049, China
  • show less
    DOI: 10.7498/aps.69.20200374 Cite this Article
    Guo-Ying Tang, Zhu-Ling Sun, Ru-Bin Jiang, Feng-Quan Li, Ming-Yuan Liu, Kun Liu, Xiu-Shu Qie. Characteristics and mechanism of a triggered lightning with two polarity reversals of charges transferred to ground[J]. Acta Physica Sinica, 2020, 69(18): 189201-1 Copy Citation Text show less
    Composited optical image shows the flash channel structure in the high-speed field (the upper part of the dotted line shows the partial natural channel, and the lower part shows the wire vaporization channel, with a height of about 171 m).
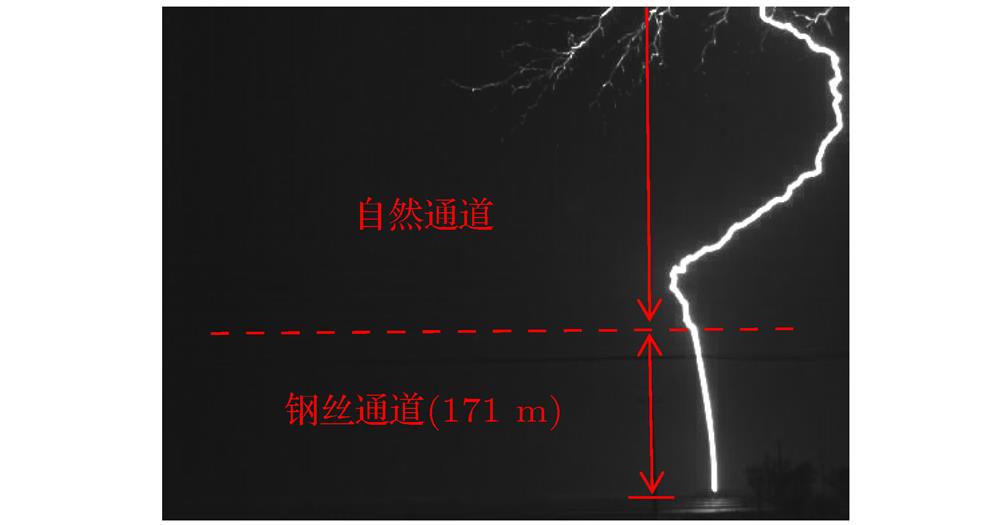
    Fig. 1. Composited optical image shows the flash channel structure in the high-speed field (the upper part of the dotted line shows the partial natural channel, and the lower part shows the wire vaporization channel, with a height of about 171 m).
    Results of multiple simultaneous observations of the overall lightning discharge process vary with time: (a) Relative luminosity for natural channel (without wire channel) from high-speed optical images; (b) channel-base current and normalized fast electric field change of the main observing station, ti (i = 0, 1, 2, 3, 4) is listed as follows: t0 = 0 ms, t1 = 123.9 ms, t2 = 152.755 ms, t3 = 218.6 ms and t4 = 239.98 ms, RL1–3 shows three recoil leaders of late stage of the lightning; (c) elevation of VHF sources vary with time, color of radiation sources change from blue to red with time, the same blow; (d) azimuth-elevation of VHF 2D map, the blue, green and red arrows indicate the development direction of UPL, NL and RL1–3 channels, S1 shows the branching point of the UPL after developing to the cloud, P shows the initial point of NL, the same blow.
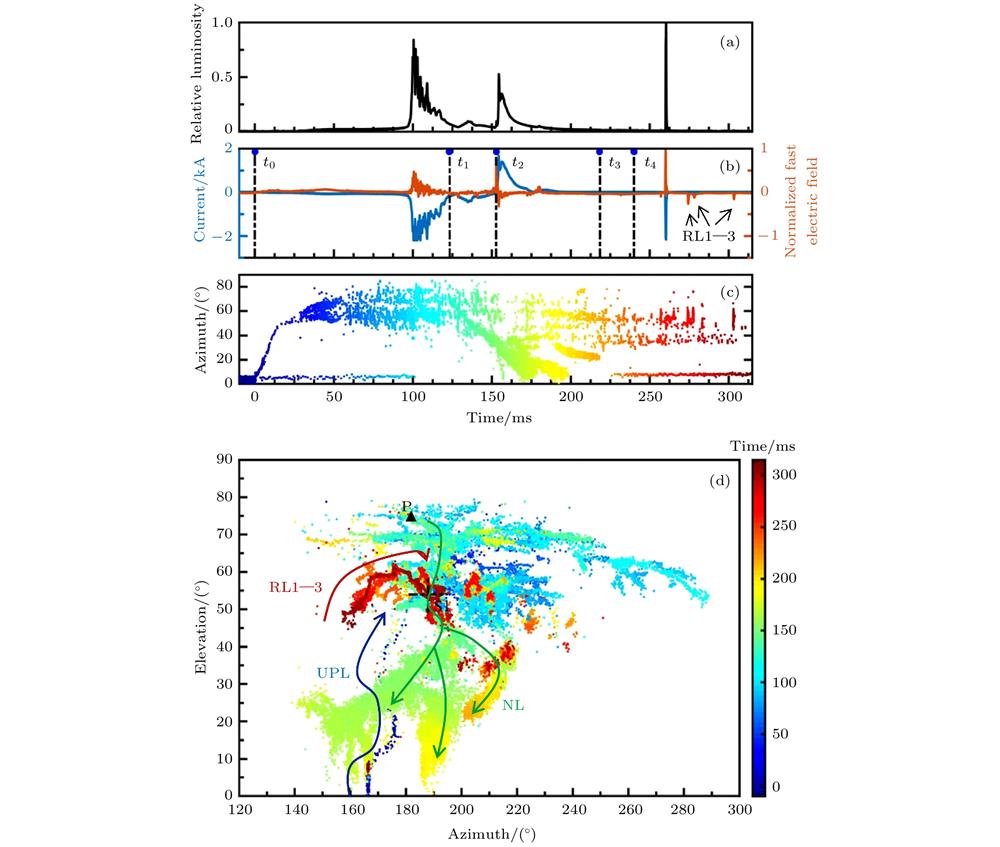
    Fig. 2. Results of multiple simultaneous observations of the overall lightning discharge process vary with time: (a) Relative luminosity for natural channel (without wire channel) from high-speed optical images; (b) channel-base current and normalized fast electric field change of the main observing station, ti (i = 0, 1, 2, 3, 4) is listed as follows: t0 = 0 ms, t1 = 123.9 ms, t2 = 152.755 ms, t3 = 218.6 ms and t4 = 239.98 ms, RL1–3 shows three recoil leaders of late stage of the lightning; (c) elevation of VHF sources vary with time, color of radiation sources change from blue to red with time, the same blow; (d) azimuth-elevation of VHF 2D map, the blue, green and red arrows indicate the development direction of UPL, NL and RL1–3 channels, S1 shows the branching point of the UPL after developing to the cloud, P shows the initial point of NL, the same blow.
    Azimuth-elevation of VHF 2D map of UPL compared with the composited high-speed optical image: (a) Azimuth-elevation of VHF 2D map of UPL; (b) composited optical image shows the flash channel structure in the high-speed field.
    Fig. 3. Azimuth-elevation of VHF 2D map of UPL compared with the composited high-speed optical image: (a) Azimuth-elevation of VHF 2D map of UPL; (b) composited optical image shows the flash channel structure in the high-speed field.
    Results of multiple simultaneous observations before and after the initiation of the NL vary with time: (a) Channel-base current and fast electric field changes; (b) elevation of VHF sources varies with time; (c) azimuth-elevation of VHF 2D map. Gray scatter points are locations of radiation sources before t1, and the red arrows are a series of recoil leaders during the development of the NL.
    Fig. 4. Results of multiple simultaneous observations before and after the initiation of the NL vary with time: (a) Channel-base current and fast electric field changes; (b) elevation of VHF sources varies with time; (c) azimuth-elevation of VHF 2D map. Gray scatter points are locations of radiation sources before t1, and the red arrows are a series of recoil leaders during the development of the NL.
    Azimuth-elevation of VHF 2D map of three RLs occurrs between the end of ICCP and the end of the lightning: (a) Azimuth-elevation of VHF 2D map of three RLs. Gray scatter points represent radiation sources location of UPL in Fig. 3; (b) schematic diagram of lightning positive branching channels and trunk channel near S1, the blue channel shows the first RL (RL1), the red channel shows the second and third RLs (RL2&RL3).
    Fig. 5. Azimuth-elevation of VHF 2D map of three RLs occurrs between the end of ICCP and the end of the lightning: (a) Azimuth-elevation of VHF 2D map of three RLs. Gray scatter points represent radiation sources location of UPL in Fig. 3; (b) schematic diagram of lightning positive branching channels and trunk channel near S1, the blue channel shows the first RL (RL1), the red channel shows the second and third RLs (RL2&RL3).
    Results of multiple simultaneous observations before and after the first polarity reversal vary with time: (a) Channel-base current and fast electric field changes; (b) elevation of VHF sources vary with time; (c) azimuth-elevation of VHF 2D map, gray scatter points are radiation sources location before the initiation of NL and RL1–3 in Fig. 5, the black solid line and dashed line represent the actual detected channel and the inferred channel, the same blow, the radiation sources in the dotted box represent negative breakdown discharge, the red arrow is the breakdown discharge after the negative polarity pulse. The subgraph is an enlarged view of the radiation source in the dotted box at t = 152.71–152.72 ms.
    Fig. 6. Results of multiple simultaneous observations before and after the first polarity reversal vary with time: (a) Channel-base current and fast electric field changes; (b) elevation of VHF sources vary with time; (c) azimuth-elevation of VHF 2D map, gray scatter points are radiation sources location before the initiation of NL and RL1–3 in Fig. 5, the black solid line and dashed line represent the actual detected channel and the inferred channel, the same blow, the radiation sources in the dotted box represent negative breakdown discharge, the red arrow is the breakdown discharge after the negative polarity pulse. The subgraph is an enlarged view of the radiation source in the dotted box at t = 152.71–152.72 ms.
    Results of multiple simultaneous observations before and after the second polarity reversal vary with time: (a) Relative luminosity of natural channel (without wire channel) from high-speed optical images; (b) channel-base current and fast electric changes, the black dotted line marks 0 kA.
    Fig. 7. Results of multiple simultaneous observations before and after the second polarity reversal vary with time: (a) Relative luminosity of natural channel (without wire channel) from high-speed optical images; (b) channel-base current and fast electric changes, the black dotted line marks 0 kA.
    Results of multiple simultaneous observations before and after the ICCP vary with time: (a) Channel-base current and fast electric field changes; (b) elevation of VHF sources varies with time; (c) azimuth-elevation of 2D map, gray scatter points is radiation sources location in Fig. 5, the radiation source points in the dotted box show the recoil leader that produces ICCP.
    Fig. 8. Results of multiple simultaneous observations before and after the ICCP vary with time: (a) Channel-base current and fast electric field changes; (b) elevation of VHF sources varies with time; (c) azimuth-elevation of 2D map, gray scatter points is radiation sources location in Fig. 5, the radiation source points in the dotted box show the recoil leader that produces ICCP.
    Schematic diagram showing the mechanism of the two polarity reversals of charges transferred to the ground: (a) Branching and cutoff of upward positive leader; (b) generation of negative leader; (c) the first reversal of the polarity of charge transferred to the ground ; (d) the second reversal of the polarity of charge transferred to the ground (red and blue channels represent positive and negative leader channels, respectively, the black channel represents the trunk channel, solid lines indicate that the channel is developing, and dashed lines indicate that the channel is extinguished).
    Fig. 9. Schematic diagram showing the mechanism of the two polarity reversals of charges transferred to the ground: (a) Branching and cutoff of upward positive leader; (b) generation of negative leader; (c) the first reversal of the polarity of charge transferred to the ground ; (d) the second reversal of the polarity of charge transferred to the ground (red and blue channels represent positive and negative leader channels, respectively, the black channel represents the trunk channel, solid lines indicate that the channel is developing, and dashed lines indicate that the channel is extinguished).
    Guo-Ying Tang, Zhu-Ling Sun, Ru-Bin Jiang, Feng-Quan Li, Ming-Yuan Liu, Kun Liu, Xiu-Shu Qie. Characteristics and mechanism of a triggered lightning with two polarity reversals of charges transferred to ground[J]. Acta Physica Sinica, 2020, 69(18): 189201-1
    Download Citation