• Photonics Research
  • Vol. 10, Issue 8, 1803 (2022)
Roberto Aiello1, Valentina Di Sarno1, Maria Giulia Delli Santi1, Maurizio De Rosa1、2, Iolanda Ricciardi1、2, Giovanni Giusfredi3, Paolo De Natale4, Luigi Santamaria5, and Pasquale Maddaloni1、2、*
Author Affiliations
  • 1Consiglio Nazionale delle Ricerche-Istituto Nazionale di Ottica, Via Campi Flegrei 34, 80078 Pozzuoli, Italy
  • 2Istituto Nazionale di Fisica Nucleare, Sez. di Napoli, Complesso Universitario di M.S. Angelo, Via Cintia, 80126 Napoli, Italy
  • 3ppqSense S.r.l., Via Gattinella 20, 50013 Campi Bisenzio, Italy
  • 4Consiglio Nazionale delle Ricerche-Istituto Nazionale di Ottica, Largo E. Fermi 6, 50125 Firenze, Italy
  • 5Agenzia Spaziale Italiana, Contrada Terlecchia, 75100 Matera, Italy
  • show less
    DOI: 10.1364/PRJ.456515 Cite this Article Set citation alerts
    Roberto Aiello, Valentina Di Sarno, Maria Giulia Delli Santi, Maurizio De Rosa, Iolanda Ricciardi, Giovanni Giusfredi, Paolo De Natale, Luigi Santamaria, Pasquale Maddaloni. Lamb-dip saturated-absorption cavity ring-down rovibrational molecular spectroscopy in the near-infrared[J]. Photonics Research, 2022, 10(8): 1803 Copy Citation Text show less

    Abstract

    The high-detection-sensitivity saturated-absorption cavity ring-down (SCAR) technique is extended to Lamb-dip spectroscopy of rovibrational molecular transitions in the near-infrared region. Frequency-comb-referenced sub-Doppler saturation measurements, performed on the acetylene (ν1+ν3+ν4ν4) R(14)e line at 6562 cm-1, are analyzed by a SCAR global line profile fitting routine, based on a specially developed theoretical model. Compared to a conventional cavity ring-down evaluation, our approach yields dip profiles with a linewidth freed from saturation broadening effects, reduced by 40%, and a signal-to-noise ratio increased by 90%. Ultimately, an overall (statistical and systematic) fractional uncertainty as low as 7×10-12 is achieved for the absolute line-center frequency. At the same time, our method is also able to accurately infer the linear (non-saturated) behavior of the gas absorption, providing Lamb-dip-based line strength measurements with a relative uncertainty of 0.5%.

    1. INTRODUCTION

    Since its inception, Lamb-dip spectroscopy has represented an invaluable tool for precise sub-Doppler investigations of energy transitions in molecules to determine their fundamental parameters and hence gain a deeper understanding of their structure [13]. Particularly, the enhanced resolution achievable in the line-center frequency measurement of vibrational and rotational spectra plays a central role in various applications, ranging from the definition of metrological standards [4,5] to the compilation of astronomical databases [68]. In more sophisticated experiments, Lamb-dip molecular spectroscopy is used to perform precise measurements of fundamental constants [9,10] or tests of quantum electrodynamics (QED) within and beyond the standard model [11], including the proton-size puzzle and searches for putative fifth forces [12].

    An essential tool to obtain Lamb-dip signals with useful signal-to-noise ratio (SNR), for aiming at frequency resolutions at the kilohertz (kHz) level or below, is represented by high-finesse optical cavities. These provide enhanced effective absorption path lengths, along with the intracavity laser powers necessary to approach the typically large saturation intensities of rovibrational transitions, also realizing perfect alignment between pump and probe beams. Until recently, basically three types of cavity-enhanced methods were effectively used for sub-Doppler saturation spectroscopy of infrared molecular transitions, enabling determination of line positions with kHz or even sub-kHz accuracy [13,14]: cavity enhanced absorption spectroscopy (CEAS) [15], cavity ring-down spectroscopy (CRDS) [16,17], and noise-immune cavity enhanced optical heterodyne molecular spectroscopy (NICE-OHMS) [12,18,19]. Cavity mode-dispersion spectroscopy (CMDS), originally demonstrated in the Doppler-limited regime a few years ago, has also been extended to Lamb-dip measurements [20].

    Among these techniques, CRDS owes its ever-increasing popularity to the greater simplicity of implementation and reliability of operation in the whole infrared spectral region, along with a very high detection sensitivity. Indeed, such a flexibility made possible application of CRDS in non-trivial experiments, allowing Lamb-dip rovibrational spectroscopy of buffer-gas-cooled molecular samples [21]. With the aim to further increase sensitivity of CRDS, Doppler-free two-photon spectroscopy of N2O rovibrational transitions at 4.53 μm wavelength has also been demonstrated [22].

    Although CRDS is not sensitive to the amplitude noise of the probe laser source, variations of the empty-cavity decay rate actually prevent us from achieving the shot noise detection limit and from averaging measurements over long times. To overcome this drawback, in 2010 a different approach to CRDS was conceived, named saturated-absorption cavity ring-down (SCAR), to remark the nonlinear nature of the technique. The essence of the SCAR approach is recording in each and every cavity ring-down event the linear molecular absorption as well as the saturated regime, corresponding to the empty-cavity losses: this effectively eliminates background signals, improving the overall sensitivity. Although its first use was to resolve a hyperfine multiplet in C16O17O by Lamb-dip spectroscopy [23], subsequent applications have exploited, instead, the enhanced SCAR sensitivity, using higher sample pressures, in a mostly Lorentzian or also inhomogeneous linewidth regime [24,25]. Until now, SCAR has been used for only two molecules, CO2 and CH4 [26], and only on fundamental rovibrational bands in the mid-IR.

    In this work, a state-of-the-art optical-frequency-comb-referenced spectrometer is used to observe sub-Doppler, near-IR rovibrational molecular transitions by a SCAR technique. As a proof of principle, the C2H2(ν1+ν3+ν4ν4) R(14)e line at 1523.92 nm wavelength is addressed, dealing with sub-Pa-pressure gas samples. Moreover, extending the primal treatment developed in broad terms for inhomogeneous linewidth profiles [27], we conceive a specific SCAR fitting model for Lamb-dip profiles. As a result, sub-Doppler saturation spectra are retrieved with improved accuracy (compared to the standard cavity-ring-down assessment) and used to investigate line center shifts and broadening effects in a pressure range hardly covered by the existing literature. Prominently, our model is also able to infer the linear (non-saturated) behavior of the gas absorption, hence providing accurate Lamb-dip-based line strength measurements.

    2. EXPERIMENTAL SETUP

    The experimental setup is schematized in Fig. 1. The main beam of an extended-cavity-diode-laser, hereafter referred to as the probe laser (PL), passes through an acousto-optic modulator (AOM) whose first-diffracted order is injected into the spectroscopic enhancement cavity. This consists of a stainless-steel spacer equipped with two facing 3-m-curvature mirrors, at a distance d=42  cm from each other. The first mirror (M1) has a 0.6-cm diameter (with a thickness of 4 mm) and reflectivity >99.97%, while the second mirror (M2) has a 2.5-cm diameter and reflectivity >99.995%. The measured empty-cavity decay time is τ0=25.4  μs, corresponding to a finesse F=(πcτ0)/d57,000. For a power Pin30  μW incident on the cavity and a coupling factor Ccav0.3, an intracavity radiation intensity as high as Icav,0=CcavPin(F/π)/(πw02)14  W/cm2 is achieved, with w0600  μm being the beam waist radius. The fraction of power reflected by M1 is used to implement the Pound–Drever–Hall (PDH) frequency-lock technique. To this aim, the PL is frequency modulated by an electro-optic phase modulator (EOM), forming sidebands at 7 MHz relative to the carrier, while a phase detector yields the error signal by means of the radiation reflected back from the cavity. This signal is then processed by a proportional-integral-derivative (PID) servo (Toptica Photonics, FALC 110), which provides external correction to the PL frequency both through a slow feedback line, acting on the piezoelectric transducer (PZT) of the extended cavity, and a fast one, acting on the current driver (1 MHz overall locking bandwidth). After that, we control the cavity length by locking it to an NIR OFCS (Menlo Systems, FC-1500-250-WG). For this purpose, the beat-note signal between the PL and the Nth comb tooth (determined by a 0.2-ppm-accuracy wavelength meter) is phase-locked to a local oscillator (νLO=30  MHz) by an electronic servo (Toptica Photonics, mFALC 110) whose correction is accomplished by a slow feedback (20 Hz bandwidth) on the PZT mounted on M1, and a fast one (10 kHz bandwidth) acting on the PZT of M2. Due to the above frequency-locking sequence, the residual laser linewidth actually entering the final spectroscopic measurement is essentially set by the width of the comb tooth (less than 100 kHz). Finally, to preserve the effectiveness of the overall frequency locking chain, two identical switches (ADG 1219, Analog Device) are used to interrupt the action of the corresponding control loops during the shutdown time required to acquire the cavity ring-down event and restore it for the next cavity build-up. Transmission from M2, detected by an InGaAs photodetector, is digitized by an 18-bit, 10-MSample/s analog-to-digital converter (NI, PXI-5922), which eventually triggers the switching off of the laser light by the AOM (at a given cavity-filling threshold), thus starting the ring-down events. A LabVIEW program governs all the experimental parameters as well as the acquisition routine.

    Sketch of the experimental setup.

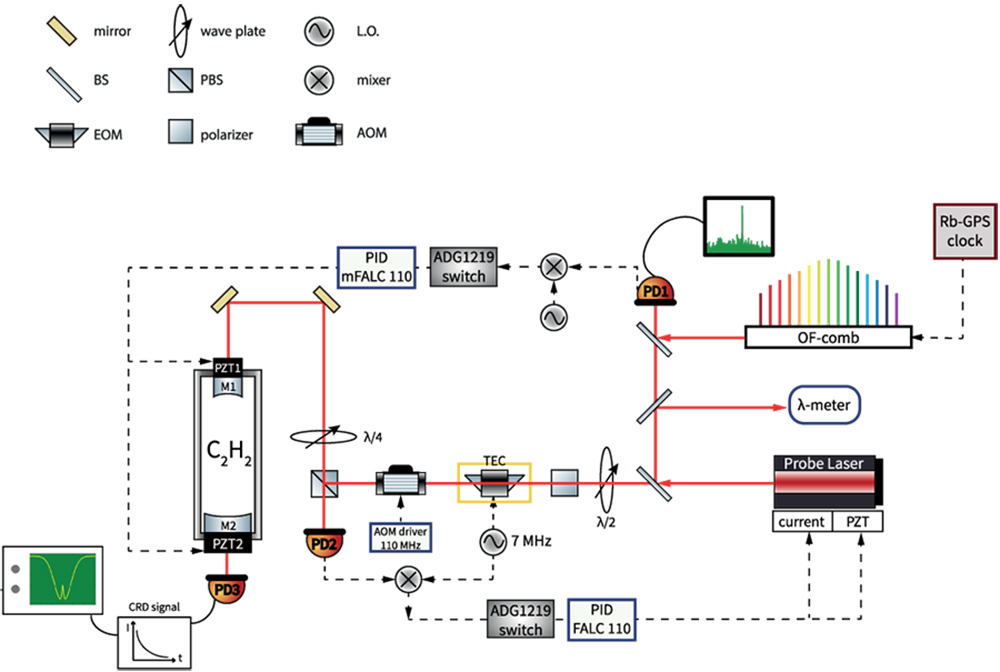
    Figure 1.Sketch of the experimental setup.

    In the above configuration, the PL frequency is given by νPL=νAOM+νCEO+NνRR+νLO, where νAOM (110 MHz) is the frequency of the signal driving the AOM, while νCEO (20 MHz) and νRR (250 MHz) denote the comb carrier-envelope offset and mode spacing, respectively. Then, νPL is absolutely determined by stabilizing both νCEO and νRR against a Rb/GPS clock, providing an accuracy of 1013 and a fractional stability (Allan deviation) between 4×10¹³ and 8×10¹³ for an integration time between 10 and 1000 s. Then, tuning of νPL across the target transition is accomplished by varying νRR in discrete steps. For each step, the average of 20 acquisitions by the 18-bit oscilloscope (each lasting 100 μs, i.e., about 4 times the empty-cavity decay time τ0) is fitted both online by a simple exponential to give the standard cavity-ring-down (CRD) absorption coefficient αCRD(νPL)=c1[τ(νPL)1τ01],and offline by the SCAR model described in the next section. A typical sweep across the Lamb-dip profile consists of 67 points spaced on average 140 kHz apart, and it takes approximately 1 min. The final spectral feature is the average over 10 single Lamb-dip profiles. For the selected rovibrational transition, this procedure is repeated by varying the gas pressure p from 0.43 to 0.72 Pa as measured by a 1% accuracy absolute capacitive pressure gauge.

    3. SCAR GLP FITTING MODEL

    To specialize the SCAR fitting model to the Lamb-dip case, we start from the theoretical expression for the absorption coefficient of a molecular transition in the inhomogeneous broadened regime [27] α(ν)=α0ln22π3/2WLWG+L(δν,νD)1+S·L(δν,νD)exp[(ln2)νD2/WG2]dνD,with L(δν,νD)=11+(δν+νDWL)2+11+(δννDWL)2.

    In the above equations, WL and WG respectively denote the Lorentzian and Gaussian widths of the absorption profile where the dip is dug; δν=νν0 is the frequency detuning from resonance; νD=vz/λ is the Doppler shift (with λ=c/ν being the probe laser wavelength and vz the component of the molecular velocity parallel to the cavity optical axis); and S=Icav,0/Isat=Pcav,0/Psat (Pcav,0=πw02Icav,0 and Psat=πw02Isat) is the saturation parameter. In turn, the saturation intensity of the transition can be expressed as Isat4πhν03c2Aγγ,where γ and γ are the molecular population decay rate and coherence relaxation rate, respectively, and A is the Einstein coefficient.

    It is worth mentioning that, in deriving Eq. (2), the standing wave inside the cavity is considered as the superposition of two counterpropagating waves of equal intensity, whose frequencies are Doppler-shifted for the molecules according to their longitudinal velocity. Focusing on Lamb-dip recordings, where δνWG, Eq. (2) simplifies to α(ν)=α0ln22π3/2WLWG+L(δν,νD)1+S·L(δν,νD)dνD.

    Next, in order to circumvent numerical integration of Eq. (5), we consider two opposite cases: δν=0 (dip center). Here, by inserting L(0,νD) into Eq. (5), we get α1=α0ln22π3/2WLWG+21+(νDWL)211+S21+(νDWL)2dνD=α0ln2πWG11+2S;|δν|WL (dip wings). In this case, according to the sign of νD, the dominant contribution to the integral in Eq. (5) comes from only one of the two L(δν,νD) terms at a time. By symmetry, the two contributions are identical, whereupon α2α0ln22π3/2WLWG2+11+S+(δν+νDWL)2d(νDWL)=α0ln2πWG11+S.

    After that, to proceed continuously from the wings to the center of the dip as a function of δν, we introduce on purpose a line shape function describing the saturation-parameter profile, D(δν), that is equal to 1 in the center and then decreases to 0 as the detuning increases in either direction, which we will call the dip constraint. Finally, we can write the Lamb-dip absorption coefficient in the form αdip=α0ln2πWG11+S[1+D(νν0)]γgc11+Ug(ν),where γg=(log2cα0)/(πWG) is the decay rate due to the linear gas absorption, and Ug(ν)S[1+D(νν0)]represents the dip saturation profile. At this point, the discussion continues along the lines of the SCAR theory [27]. First, we write the rate equation for the intracavity laser power as P˙cavdPcavdt=γcPcavcdPcavdz,where γc is the empty-cavity decay rate, and the second term corresponds to the gas absorption. The latter can be calculated by expressing the spatial distribution of the intracavity laser intensity as Icav=Icav,0exp[(x2+y2)/w02] (an average intensity is supposed in the longitudinal direction), and assuming a fixed radial position of the molecules (indeed, despite the very low gas pressures used in this experiment, the molecular mean free path is still smaller than the laser beam diameter). Then, Eq. (10) becomes P˙cav=γcPcavc++αdip(Icav)·Icav(x,y)dxdy,which, after integration, leads to the following differential equation: P˙cav=γcPcavγg21+1+Ug(ν)Pcav.

    Then, we factorize the intracavity power as Pcav(t)=Pcav,0eγctf(t), where the function f(t), with f(0)=1, describes the deviation from a purely exponential decay, due to the saturated gas absorption. Thus, Eq. (12) translates into a differential equation for f: f˙=γg21+1+eγctf(t)Ug(ν)f(t).

    Also, interference effects originating from residual nonlinearities of the detection system are empirically taken into account by an additional term of the same form. Thus, Eq. (13) becomes f˜˙=γg21+1+eγctf(t)Ug(ν)f˜(t)γi21+1+eγctf(t)Uif˜(t),where γi and Ui are assumed to be frequency independent because of the very small PL frequency scan. Eventually, the fitting function of the single cavity-decay events takes the form S(t)=B+Aeγctf˜(t;γc,γg,Ug,γi,Ui),where A and B are the signal amplitude and background, respectively. Ultimately, in principle, for each νPL value, the corresponding ring-down signal is fitted by Eq. (15), with Eq. (14) being numerically integrated in the fitting routine, in order to extract the various parameters: A, B, γc, γg, γi, Ug, Ui. Denoting with Ug,pk and Ug,o the peak and offset value of Ug(νPL), respectively, the dip constraint here translates into the condition Ug,pk=2Ug,o. In practice, Eq. (15) is used in a global fit procedure [where Eq. (14) is numerically integrated], which can be divided into two steps.We set a common initial threshold for all the cavity-decay signals, chosen in such a way that the part of the decay that deviates strongly from the simple exponential has the same duration as the subsequent one. After that, we simultaneously fit all the decay events corresponding to the different νPL values and across the various gas pressures. This is done by assuming a Lorentzian shape for D(νν0), with the constraint Ug,pk(p)=2Ug,o(p), while imposing that the mean value of γg(p) over the PL frequency scan interval is proportional to p and that the line-center frequency and width of the dip profile are linear with p.After this global initialization, for each pressure p, Ug(νPL,p), A(νPL,p), and B(νPL,p) are extracted afresh by fitting the cavity decay signals of the corresponding dip, while keeping γg(p), γc, Ui, and γi fixed at the values estimated in the previous step.

    4. SPECTROSCOPIC ANALYSIS

    Then, as shown in Fig. 2, the SCAR Lamb-dip saturation profiles Ug(νPL,p) are compared with those obtained via the usual CRD analysis [based on Eq. (1)] using a Lorentzian line shape fit function for both cases. It is worth noting that, even within the standard CRD analysis, the saturation contrast, defined as the ratio between the depth of the dip and that of the underlying Doppler-limited profile, reaches much higher values than usual, up to 20%. Indeed, due to the relatively high value of the Einstein coefficient for our target transition (A=4.4  Hz, from the HITRAN database [28]), in conjunction with the large intracavity radiation intensity, a strong saturation regime (S1) is achieved, contrary to what happens in the vast majority of Lamb-dip spectroscopy experiments. This circumstance reinforces the need for a SCAR-type analysis of the cavity decay events, which considerably deviate from a simple exponential.

    Comparison between Lamb-dip profiles of the C2H2 (ν1+ν3+ν4←ν4) R(14)e rovibrational transition, obtained by the CRD (upper frame) and SCAR (lower frame) fit of the cavity decay events, respectively, as a function of the gas pressure. In the SCAR case, an SNR as high as 110 is reached (for p=0.59 Pa).

    Figure 2.Comparison between Lamb-dip profiles of the C2H2(ν1+ν3+ν4ν4) R(14)e rovibrational transition, obtained by the CRD (upper frame) and SCAR (lower frame) fit of the cavity decay events, respectively, as a function of the gas pressure. In the SCAR case, an SNR as high as 110 is reached (for p=0.59  Pa).

    The first outcome of the comparison is that, while in the CRD case the SNR (i.e., the dip height over the RMS of the fit residuals) ranges from 45 to 58, in the SCAR case it increases to the range from 70 to 110, corresponding to a maximum enhancement of 90%.

    Second, we test the ability of the two analysis methods to retrieve the linear behavior of the gas absorption, in addition to the (nonlinear) saturation profiles. To this aim, in the CRD case, we use the dip offset y0(p), which in fact coincides with the peak of the underlying Doppler-limited absorption profile. In the SCAR case, γg(p), as obtained in the first step of the global fit procedure, is instead used. The comparison is shown in Fig. 3, where both y0(p) and γg(p) are fitted by a straight with the intercept set to zero, from which it is immediately apparent that no reliable information can be obtained from the CRD slope, sCRD=(4.7±0.5)×107  cm1/Pa. By contrast, the SCAR slope, sSCAR=1.284×10⁶  cm1/Pa, returns a line strength value S0,SCAR(Tm)=sSCAR(kBTm)3/22π/M(ν0/c)=(9.01±0.05)×1023  cm/molec, with Tm=298(1)  K being the measured temperature and M the molecular mass. Interestingly, the S0,SCAR value is in very good agreement with that measured in the linear (non-saturated) regime with a separate laser absorption spectrometer (between 1500 and 5000 Pa): S0,lin=(9.6±0.3)×1022, close to the HITRAN value (1.53×10²²  cm/molec).

    Linear fit (with intercept set to zero) to the y0(p) and γg(p) trends. While the CRD measurements obviously cannot give meaningful information on the linear absorption regime, the SCAR slope, although extracted in the sub-Pa range (even in the strong saturation regime), aligns with that determined at much higher pressures (between 1500 and 5000 Pa) by a simple (not cavity-enhanced) laser absorption spectrometer.

    Figure 3.Linear fit (with intercept set to zero) to the y0(p) and γg(p) trends. While the CRD measurements obviously cannot give meaningful information on the linear absorption regime, the SCAR slope, although extracted in the sub-Pa range (even in the strong saturation regime), aligns with that determined at much higher pressures (between 1500 and 5000 Pa) by a simple (not cavity-enhanced) laser absorption spectrometer.

    After that, we analyze the behavior of the key spectral line parameters of the dip, namely, the Lorentzian width (FWHM) ΓL and the line-center frequency ν0.

    Figure 4 shows the respective ΓL(p) trends. The SCAR FWHMs are reduced on average by 36%, compared to the CRD ones. This happens because, as can be clearly seen from Eq. (9), saturation broadening effects are left out of the widths in the Ug profiles. The slope of a linear fit to the SCAR data points provides the self-pressure-broadening coefficient γself=(450±60)  kHz/Pa, whereas the intercept γ0=(270±40)  kHz is consistent with the sum of the expected transit-time broadening contribution γtt=w01(kBTm)/8M)180  kHz, and the residual laser emission linewidth.

    Lamb-dip FWHMs provided by the SCAR and CRD analysis, respectively.

    Figure 4.Lamb-dip FWHMs provided by the SCAR and CRD analysis, respectively.

    Finally, the SCAR ν0(p) behavior is illustrated in Fig. 5. Since no clear trend is recognized, the weighted average of the determinations at the five different pressures provides our best estimate for the line-center frequency: ν0=(196,724,103,036.9±1.2)  kHz, about 4 MHz away from the HITRAN value (6562.0096  cm1, 30 MHz accuracy). The achieved uncertainty is about one-third of what is obtained by the CRD analysis, mainly as a consequence of the combined higher SNR and narrower FWHM of the dip profiles. Our result is in line with recent extensive Lamb-dip investigations indicating little or nonexisting pressure-induced shift [7,16,29].

    SCAR line-center frequency determinations as a function of p. As mentioned in the text, the self-collisional shift coefficient could not be significantly estimated (by the slope of a linear fit): δself=(−3±6) kHz/Pa.

    Figure 5.SCAR line-center frequency determinations as a function of p. As mentioned in the text, the self-collisional shift coefficient could not be significantly estimated (by the slope of a linear fit): δself=(3±6)  kHz/Pa.

    Concerning systematic uncertainty, the relevant sources are listed in Table 1. The stability of the GPS-based reference chain contributes with an uncertainty of 0.5 kHz (from the measured Allan deviation at 60 s), while the uncertainty in the AOM driving frequency is only at the Hertz (Hz) level. The accuracy of the pressure gauge (1%) translates into a contribution of δself·0.006Pa40  Hz. Moreover, the second-order Doppler shift is estimated as ν0kBTm/(Mc2)=0.3  kHz, the recoil shift being canceled out in Lamb-dip spectroscopy [30]. Also, a 15% uncertainty on the intracavity power, as weighted with a shift coefficient of 10  Hz/mW [21], gives a contribution below 0.2 kHz. Finally, by allowing the static width of the Lorentzian line shape to vary sigmoidally, an uncertainty around 60 Hz is assigned to asymmetries in the Lamb-dip fit. By adding in quadrature all the terms, the overall (type A + type B) 1σ uncertainty amounts to 1.4 kHz (7×10¹² in fractional terms).

    Summary of Major Uncertainties Associated with the Absolute Determination of the Center Frequency of the C2H2(ν1+ν3+ν4ν4) R(14)e Rovibrational Transition for p=0.59  Pa

    ContributionUncertainty (kHz)
    Statistical1.2
    Pressure shift0.04
    GPS-based reference chain0.5
    Power shift0.2
    Second-order Doppler shift0.3
    Lamb-dip profile fit0.06
    Total1.4

    5. CONCLUSION

    In conclusion, we have extended the high-detection-sensitivity SCAR technique to sub-Doppler saturation spectroscopy of molecular transitions in the telecom wavelength range by developing an original theoretical model for the Lamb-dip regime. This allowed us to achieve sub-Doppler absorption profiles immune to saturation broadening effects and with SNRs in excess of 100, leading to absolute line-center frequency determinations approaching the sub-kHz range. This may pave the way to future investigations of elusive effects, such as speed-dependent collisional broadening and frequency shifts in Lamb-dip spectra [31]. Importantly, our approach has proven capable of accurately retrieving, even in the strong saturation regime, the linear behavior of the gas absorption, too. This indeed enabled precise line strength measurements from Lamb-dip recordings. Our versatile scheme, here addressed to the C2H2 molecule in the near-IR range, may be straightforwardly applied to many other species in different spectral regions, thus contributing to the improvement of databases of atmospheric or astrophysical interest. Furthermore, we plan to apply the present spectroscopic method to molecular samples at a temperature of a few kelvins, as produced by our buffer-gas-cooling source, particularly to calculable systems (H2 and its isotopomers), in order to significantly improve the current accuracy of QED tests [32,33].

    Acknowledgment

    Acknowledgment. The authors acknowledge fruitful discussions with L. Gianfrani and A. Castrillo.

    References

    [1] W. E. Lamb. Theory of an optical maser. Phys. Rev., 134, A1429-A1450(1964).

    [2] T. W. Hänsch, A. L. Schawlow, G. W. Series. The spectrum of atomic hydrogen. Sci. Am., 240, 94-110(1979).

    [3] M. L. Diouf, R. Tóbiás, I. Simkó, F. M. Cozijn, E. J. Salumbides, W. Ubachs, A. G. Császár. Network-based design of near-infrared Lamb-dip experiments and the determination of pure rotational energies of H218O at kHz accuracy. J. Phys. Chem. Ref. Data, 50, 023106(2021).

    [4] A. A. Madej, J. E. Bernard, A. J. Alcock, A. Czajkowski, S. Chepurov. Accurate absolute frequencies of the v1 + v3 band of 13C2H2 determined using an infrared mode-locked Cr:YAG laser frequency comb. J. Opt. Soc. Am. B, 23, 741-749(2006).

    [5] S. Saraf, P. Berceau, A. Stochino, R. Byer, J. Lipa. Molecular frequency reference at 1.56 μm using a 12C16O overtone transition with the noise-immune cavity-enhanced optical heterodyne molecular spectroscopy method. Opt. Lett., 41, 2189-2192(2016).

    [6] K. L. Chubb, J. Tennyson, S. N. Yurchenko. ExoMol molecular line lists-XXXVII. Spectra of acetylene. Mon. Not. R. Astron. Soc., 493, 1531-1545(2020).

    [7] O. Votava, S. Kassi, A. Campargue, D. Romanini. Comb coherence-transfer and cavity ring-down saturation spectroscopy around 1.65 μm: kHz-accurate frequencies of transitions in the 2v3 band of 12CH4. Phys. Chem. Chem. Phys., 24, 4157-4173(2022).

    [8] R. Tóbiás, T. Furtenbacher, I. Simkó, A. G. Császár, M. L. Diouf, F. M. Cozijn, J. M. Staa, E. J. Salumbides, W. Ubachs. Spectroscopic-network-assisted precision spectroscopy and its application to water. Nat. Commun., 11, 1708(2020).

    [9] S. Alighanbari, M. G. Hansen, V. I. Korobov, S. Schiller. Rotational spectroscopy of cold and trapped molecular ions in the Lamb-Dicke regime. Nat. Phys., 14, 555-561(2018).

    [10] L. G. Tao, A. W. Liu, K. Pachucki, J. Komasa, Y. R. Sun, J. Wang, S. M. Hu. Toward a determination of the proton-electron mass ratio from the Lamb-dip measurement of HD. Phys. Rev. Lett., 120, 153001(2018).

    [11] M. S. Safronova, D. Budker, D. Demille, D. F. Kimball, A. Derevianko, C. W. Clark. Search for new physics with atoms and molecules. Rev. Mod. Phys., 90, 025008(2018).

    [12] F. M. Cozijn, P. Dupré, E. J. Salumbides, K. S. Eikema, W. Ubachs. Sub-doppler frequency metrology in HD for tests of fundamental physics. Phys. Rev. Lett., 120, 153002(2018).

    [13] T. P. Hua, Y. R. Sun, J. Wang, C. L. Hu, L. G. Tao, A. W. Liu, S. M. Hu. Cavity-enhanced saturation spectroscopy of molecules with sub-kHz accuracy. Chin. J. Chem. Phys., 32, 107-112(2019).

    [14] Y. Tan, Y.-R. Xu, T.-P. Hua, A.-W. Liu, J. Wang, Y. R. Sun, S.-M. Hu. Cavity-enhanced saturated absorption spectroscopy of the (30012)−(00001) band of 12C16O2. J. Chem. Phys., 156, 044201(2022).

    [15] D. Gatti, R. Gotti, A. Gambetta, M. Belmonte, G. Galzerano, P. Laporta, M. Marangoni. Comb-locked Lamb-dip spectrometer. Sci. Rep., 6, 27183(2016).

    [16] J. Wang, Y. R. Sun, L. G. Tao, A. W. Liu, S. M. Hu. Communication: molecular near-infrared transitions determined with sub-kHz accuracy. J. Chem. Phys., 147, 091103(2017).

    [17] S. Kassi, T. Stoltmann, M. Casado, M. Daëron, A. Campargue. Lamb dip CRDS of highly saturated transitions of water near 1.4 μm. J. Chem. Phys., 148, 054201(2018).

    [18] J. Ye, L.-S. Ma, J. L. Hall. Sub-Doppler optical frequency reference at 1.064 μm by means of ultrasensitive cavity-enhanced frequency modulation spectroscopy of a C2HD overtone transition. Opt. Lett., 21, 1000-1002(1996).

    [19] M. Melosso, M. L. Diouf, L. Bizzocchi, M. E. Harding, F. M. J. Cozijn, C. Puzzarini, W. Ubachs. Hyperfine-resolved near-infrared spectra of H217O. J. Phys. Chem. A, 125, 7884-7890(2021).

    [20] K. Bielska, A. Cygan, M. Konefał, G. Kowzan, M. Zaborowski, D. Charczun, S. Wójtewicz, P. Wcisło, P. Masłowski, R. Ciuryło, D. Lisak. Frequency-based dispersion Lamb-dip spectroscopy in a high finesse optical cavity. Opt. Express, 29, 39449-39460(2021).

    [21] V. Di Sarno, R. Aiello, M. De Rosa, I. Ricciardi, S. Mosca, G. Notariale, P. De Natale, L. Santamaria, P. Maddaloni. Lamb-dip spectroscopy of buffer-gas-cooled molecules. Optica, 6, 436-439(2019).

    [22] G. Zhao, D. M. Bailey, A. J. Fleisher, J. T. Hodges, K. K. Lehmann. Doppler-free two-photon cavity ring-down spectroscopy of a nitrous oxide (N2O) vibrational overtone transition. Phys. Rev. A, 101, 062509(2020).

    [23] G. Giusfredi, S. Bartalini, S. Borri, P. Cancio, I. Galli, D. Mazzotti, P. De Natale. Saturated-absorption cavity ring-down spectroscopy. Phys. Rev. Lett., 104, 110801(2010).

    [24] I. Galli, P. C. Pastor, G. Di Lonardo, L. Fusina, G. Giusfredi, D. Mazzotti, F. Tamassia, P. De Natale. The v3 band of 14C16O2 molecule measured by optical-frequency-comb-assisted cavity ring-down spectroscopy. Mol. Phys., 109, 2267-2272(2011).

    [25] I. Galli, S. Bartalini, R. Ballerini, M. Barucci, P. Cancio, M. De Pas, G. Giusfredi, D. Mazzotti, N. Akikusa, P. De Natale. Spectroscopic detection of radiocarbon dioxide at parts-per-quadrillion sensitivity. Optica, 3, 385-388(2016).

    [26] I. Sadiek, G. Friedrichs. Saturation dynamics and working limits of saturated absorption cavity ringdown spectroscopy. Phys. Chem. Chem. Phys., 18, 22978-22989(2016).

    [27] G. Giusfredi, I. Galli, D. Mazzotti, P. Cancio, P. De Natale. Theory of saturated-absorption cavity ring-down: radiocarbon dioxide detection, a case study. J. Opt. Soc. Am. B, 32, 2223-2237(2015).

    [28] I. E. Gordon, L. S. Rothman, R. J. Hargreaves, R. Hashemi, E. V. Karlovets, F. M. Skinner, E. K. Conway, C. Hill, R. V. Kochanov, Y. Tana, P. Wcisło, A. A. Finenko, K. Nelson, P. F. Bernath, M. Birk, V. Boudon, A. Campargue, K. V. Chance, A. Coustenis, B. J. Drouin, J.-M. Flaud, R. R. Gamache, J. T. Hodges, D. Jacquemart, E. J. Mlawer, A. V. Nikitin, V. I. Perevalov, M. Rotger, J. Tennyson, G. C. Toon, H. Tran, V. G. Tyuterev, E. M. Adkins, A. Baker, A. Barbe, E. Canè, A. G. Császár, A. Dudaryonok, O. Egorov, A. J. Fleisher, H. Fleurbaey, A. Foltynowicz, T. Furtenbacher, J. J. Harrison, J.-M. Hartmann, V.-M. Horneman, X. Huang, T. Karman, J. Karns, S. Kassi, I. Kleiner, V. Kofman, F. Kwabia-Tchana, N. N. Lavrentieva, T. J. Lee, D. A. Long, A. A. Lukashevskaya, O. M. Lyulin, V. Yu. Makhnev, W. Matt, S. T. Massie, M. Melosso, S. N. Mikhailenko, D. Mondelain, H. S. P. Müller, O. V. Naumenko, A. Perrin, O. L. Polyansky, E. Raddaoui, P. L. Raston, Z. D. Reed, M. Rey, C. Richard, R. Tóbiás, I. Sadiek, D. W. Schwenke, E. Starikova, K. Sung, F. Tamassia, S. A. Tashkun, J. Vander Auwera, I. A. Vasilenko, A. A. Vigasin, G. L. Villanueva, B. Vispoel, G. Wagner, A. Yachmenev, S. N. Yurchenko. The HITRAN2020 molecular spectroscopic database. J. Quant. Spectrosc. Radiat. Transfer, 277, 107949(2022).

    [29] S. Twagirayezu, G. E. Hall, T. J. Sears. Frequency measurements and self-broadening of sub-Doppler transitions in the v1+v3 band of C2H2. J. Chem. Phys., 149, 154308(2018).

    [30] E. Fasci, S. Gravina, G. Porzio, A. Castrillo, L. Gianfrani. Lamb-dip cavity ring-down spectroscopy of acetylene at 1.4 μm. New J. Phys., 23, 123023(2021).

    [31] S. Wójtewicz, A. Cygan, K. Kropidłowska, M. Marangoni, P. Masłowski, D. Lisak, R. Ciuryło. Speed-dependent effects in Doppler-free saturation spectra. J. Mol. Spectrosc., 351, 21-28(2018).

    [32] W. Ubachs, J. C. Koelemeij, K. S. Eikema, E. J. Salumbides. Physics beyond the standard model from hydrogen spectroscopy. J. Mol. Spectrosc., 320, 1-12(2016).

    [33] M. Puchalski, J. Komasa, K. Pachucki. Hyperfine structure of the first rotational level in H2,D2, and HD molecules and the deuteron quadrupole moment. Phys. Rev. Lett., 125, 253001(2020).

    Roberto Aiello, Valentina Di Sarno, Maria Giulia Delli Santi, Maurizio De Rosa, Iolanda Ricciardi, Giovanni Giusfredi, Paolo De Natale, Luigi Santamaria, Pasquale Maddaloni. Lamb-dip saturated-absorption cavity ring-down rovibrational molecular spectroscopy in the near-infrared[J]. Photonics Research, 2022, 10(8): 1803
    Download Citation