• Photonics Research
  • Vol. 11, Issue 9, 1484 (2023)
Nicolò Leone1、*, Stefano Azzini1, Sonia Mazzucchi2, Valter Moretti2, Matteo Sanna1, Massimo Borghi3, Gioele Piccoli4, Martino Bernard4, Mher Ghulinyan4, and Lorenzo Pavesi1
Author Affiliations
  • 1Department of Physics, University of Trento, 38122 Trento, Italy
  • 2Department of Mathematics and TIFPA, University of Trento, 38122 Trento, Italy
  • 3Department of Physics, University of Pavia, 27100 Pavia, Italy
  • 4Centre for Sensors and Devices, Fondazione Bruno Kessler, 38123 Povo, Italy
  • show less
    DOI: 10.1364/PRJ.488875 Cite this Article Set citation alerts
    Nicolò Leone, Stefano Azzini, Sonia Mazzucchi, Valter Moretti, Matteo Sanna, Massimo Borghi, Gioele Piccoli, Martino Bernard, Mher Ghulinyan, Lorenzo Pavesi. Generation of quantum-certified random numbers using on-chip path-entangled single photons from an LED[J]. Photonics Research, 2023, 11(9): 1484 Copy Citation Text show less
    Qubit encoding. Two qubits describe the system and are encoded according to the absolute and relative positions of the waveguide in which the photon is injected with respect to the dashed white line. The values of the two qubits are fixed using the following bases: absolute position (up |U⟩ and down |D⟩) and relative position (far |F⟩ and near |N⟩).
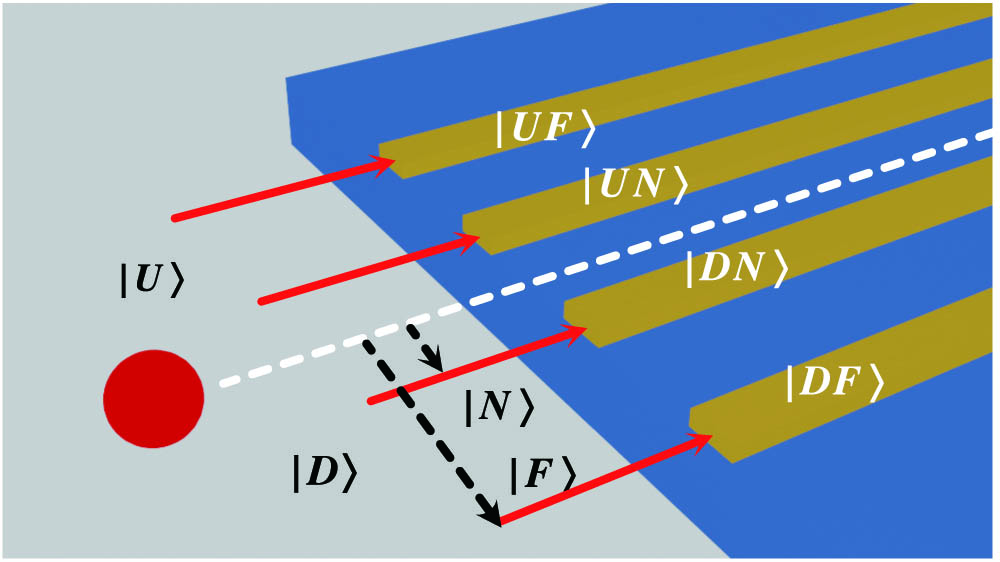
    Fig. 1. Qubit encoding. Two qubits describe the system and are encoded according to the absolute and relative positions of the waveguide in which the photon is injected with respect to the dashed white line. The values of the two qubits are fixed using the following bases: absolute position (up |U and down |D) and relative position (far |F and near |N).
    Schematic representation of the PIC used for random number generation based on SPE. In cyan, the optical waveguides; in blue, the oxide cladding. A red LED is used as a light source. Light coupling in and out of the PIC is performed using tapered optical fibers (transparent cones in the drawing). The PIC can be divided into three parts: generation, relative-position rotation, and absolute-position rotation. The generation stage is enclosed by the yellow rectangle on the left side. Here, the entangled state is created. The relative-position rotation corresponds to the first green rectangle from the left: here two MZIs rotate the qubit of relative position by an angle ϕ. The absolute-position rotation stage is found in the large green rectangle on the right side: here two MZIs rotate the qubit of absolute position by an angle θ. At the output, the rotated state is projected onto one of the four states composing the basis of the four-dimensional Hilbert space: |UF⟩,|UN⟩,|DF⟩, and |DN⟩. List of abbreviations: MMI, multi-mode interferometer; PS, phase shifter; MZI, Mach–Zehnder interferometer; CR, crossing; SPADs, single-photon avalanche diodes.
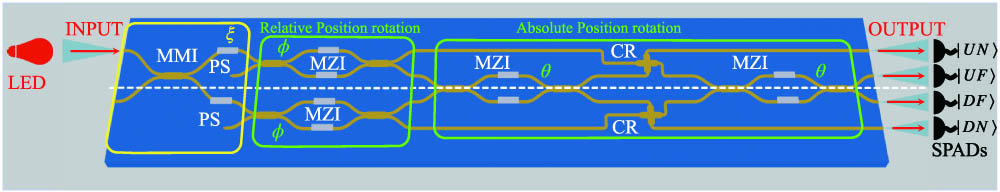
    Fig. 2. Schematic representation of the PIC used for random number generation based on SPE. In cyan, the optical waveguides; in blue, the oxide cladding. A red LED is used as a light source. Light coupling in and out of the PIC is performed using tapered optical fibers (transparent cones in the drawing). The PIC can be divided into three parts: generation, relative-position rotation, and absolute-position rotation. The generation stage is enclosed by the yellow rectangle on the left side. Here, the entangled state is created. The relative-position rotation corresponds to the first green rectangle from the left: here two MZIs rotate the qubit of relative position by an angle ϕ. The absolute-position rotation stage is found in the large green rectangle on the right side: here two MZIs rotate the qubit of absolute position by an angle θ. At the output, the rotated state is projected onto one of the four states composing the basis of the four-dimensional Hilbert space: |UF,|UN,|DF, and |DN. List of abbreviations: MMI, multi-mode interferometer; PS, phase shifter; MZI, Mach–Zehnder interferometer; CR, crossing; SPADs, single-photon avalanche diodes.
    Schematic representation of the different phases (green) associated with each MZI with the relative phase errors (white). Each green rectangle highlights the rotation operation performed by the considered MZI according to its phases.
    Fig. 3. Schematic representation of the different phases (green) associated with each MZI with the relative phase errors (white). Each green rectangle highlights the rotation operation performed by the considered MZI according to its phases.
    Experimental correlation coefficients E(ϕ,θ)) (blue dots) with the related fit (colored surface), according to Eq. (45). ϕ is the rotation angle of the relative-position qubit, while θ is the rotation angle of the absolute-position qubit. Color bar refers to the value of E.
    Fig. 4. Experimental correlation coefficients E(ϕ,θ)) (blue dots) with the related fit (colored surface), according to Eq. (45). ϕ is the rotation angle of the relative-position qubit, while θ is the rotation angle of the absolute-position qubit. Color bar refers to the value of E.
    Experimental demonstration of the violation of the Bell inequality. Data points (red dots) with their error bars (smaller than the size of the data points) and the theoretical curve (blue line) of the χ correlation function, both with respect to the parameter α. In cyan, the areas corresponding to violation of the Bell inequality. Due to a failure of the wire bonding of one PS of one MZI, it was possible to acquire only data points in a limited range of α.
    Fig. 5. Experimental demonstration of the violation of the Bell inequality. Data points (red dots) with their error bars (smaller than the size of the data points) and the theoretical curve (blue line) of the χ correlation function, both with respect to the parameter α. In cyan, the areas corresponding to violation of the Bell inequality. Due to a failure of the wire bonding of one PS of one MZI, it was possible to acquire only data points in a limited range of α.
    (a) Method to generate a random number: (1) an SPE state is generated (yellow box); (2) the relative- and absolute-position qubits of the SPE state are rotated respectively by the angles ϕi (first green box) and θj (second green box) by the different MZIs; (3) the rotated SPE state is measured by state projection on one of the four basis states (|UF⟩,|UN⟩,|DF⟩,|DN⟩) and the clicking SPAD determines the raw number. These steps are repeated many times to generate a raw sequence of random numbers. (b) Example of the random number sequence obtained using the encoding |UF⟩→00,|UN⟩→01,|DF⟩→10,|DN⟩→11 given a certain pair (ϕi, θj). The outcome of multiple detection events is randomized (slots with * in the figure), while time bins with no detection are discarded.
    Fig. 6. (a) Method to generate a random number: (1) an SPE state is generated (yellow box); (2) the relative- and absolute-position qubits of the SPE state are rotated respectively by the angles ϕi (first green box) and θj (second green box) by the different MZIs; (3) the rotated SPE state is measured by state projection on one of the four basis states (|UF,|UN,|DF,|DN) and the clicking SPAD determines the raw number. These steps are repeated many times to generate a raw sequence of random numbers. (b) Example of the random number sequence obtained using the encoding |UF00,|UN01,|DF10,|DN11 given a certain pair (ϕi, θj). The outcome of multiple detection events is randomized (slots with * in the figure), while time bins with no detection are discarded.
    (a) Probabilities of each measurement outcome as a function of time (blue |DF⟩, red |DN⟩, yellow |UN⟩, and purple |UF⟩) for the four pairs of angles (ϕ0,θ0), (ϕ1,θ0), (ϕ0,θ1), (ϕ1,θ1) of χ+. The estimates have been done considering time intervals of 50 ms. (b) Dots: corresponding values of χ+ as a function of time. Solid line: mean value of χ+. Dashed region: 99% confidence interval.
    Fig. 7. (a) Probabilities of each measurement outcome as a function of time (blue |DF, red |DN, yellow |UN, and purple |UF) for the four pairs of angles (ϕ0,θ0), (ϕ1,θ0), (ϕ0,θ1), (ϕ1,θ1) of χ+. The estimates have been done considering time intervals of 50 ms. (b) Dots: corresponding values of χ+ as a function of time. Solid line: mean value of χ+. Dashed region: 99% confidence interval.
    (a) Probabilities of each measurement outcome as a function of time (blue |DF⟩, red |DN⟩, yellow |UN⟩, and purple |UF⟩) for the four pairs of angles (ϕ0,θ0), (ϕ1,θ0), (ϕ0,θ1), (ϕ1,θ1) of χ−. The estimates have been done considering time intervals of 50 ms. (b) Dots: corresponding values of χ− as a function of time. Solid line: mean value of χ−. Dashed region: 99% confidence interval.
    Fig. 8. (a) Probabilities of each measurement outcome as a function of time (blue |DF, red |DN, yellow |UN, and purple |UF) for the four pairs of angles (ϕ0,θ0), (ϕ1,θ0), (ϕ0,θ1), (ϕ1,θ1) of χ. The estimates have been done considering time intervals of 50 ms. (b) Dots: corresponding values of χ as a function of time. Solid line: mean value of χ. Dashed region: 99% confidence interval.
    Measured transmission spectrum of a single crossing in SiON.
    Fig. 9. Measured transmission spectrum of a single crossing in SiON.
    Measured transmission spectra of an MMI-based integrated beam splitter made of SiON.
    Fig. 10. Measured transmission spectra of an MMI-based integrated beam splitter made of SiON.
     δϕ1δϕ2δϕ3δϕ4δθ1δθ2δθ3δθ4
    χ+0.0000.011−0.004−0.0060.0680.2160.0360.215
    χ0.0020.0040.007−0.0060.0680.1870.0360.180
    Table 1. Errors on the Rotation Angles ϕ and θ in the Estimation of χ±a
    Nicolò Leone, Stefano Azzini, Sonia Mazzucchi, Valter Moretti, Matteo Sanna, Massimo Borghi, Gioele Piccoli, Martino Bernard, Mher Ghulinyan, Lorenzo Pavesi. Generation of quantum-certified random numbers using on-chip path-entangled single photons from an LED[J]. Photonics Research, 2023, 11(9): 1484
    Download Citation