• Chinese Journal of Lasers
  • Vol. 51, Issue 10, 1002308 (2024)
Xiangyuan Chen, Huiliang Wei*, Tingting Liu, Kai Zhang, Jiansen Li, Zhiyong Zou, and Wenhe Liao
Author Affiliations
  • School of Mechanical Engineering, Nanjing University of Science and Technology, Nanjing 210094, China
  • show less
    DOI: 10.3788/CJL240472 Cite this Article Set citation alerts
    Xiangyuan Chen, Huiliang Wei, Tingting Liu, Kai Zhang, Jiansen Li, Zhiyong Zou, Wenhe Liao. In‑Situ Monitoring and Diagnostics for Deposition Defects in Laser Powder Bed Fusion Process Based on Optical Signals of Melt Pool (Invited)[J]. Chinese Journal of Lasers, 2024, 51(10): 1002308 Copy Citation Text show less
    Deposition defects caused by powder spreading during printing. (a) Before printing; (b) during printing; (c) after printing
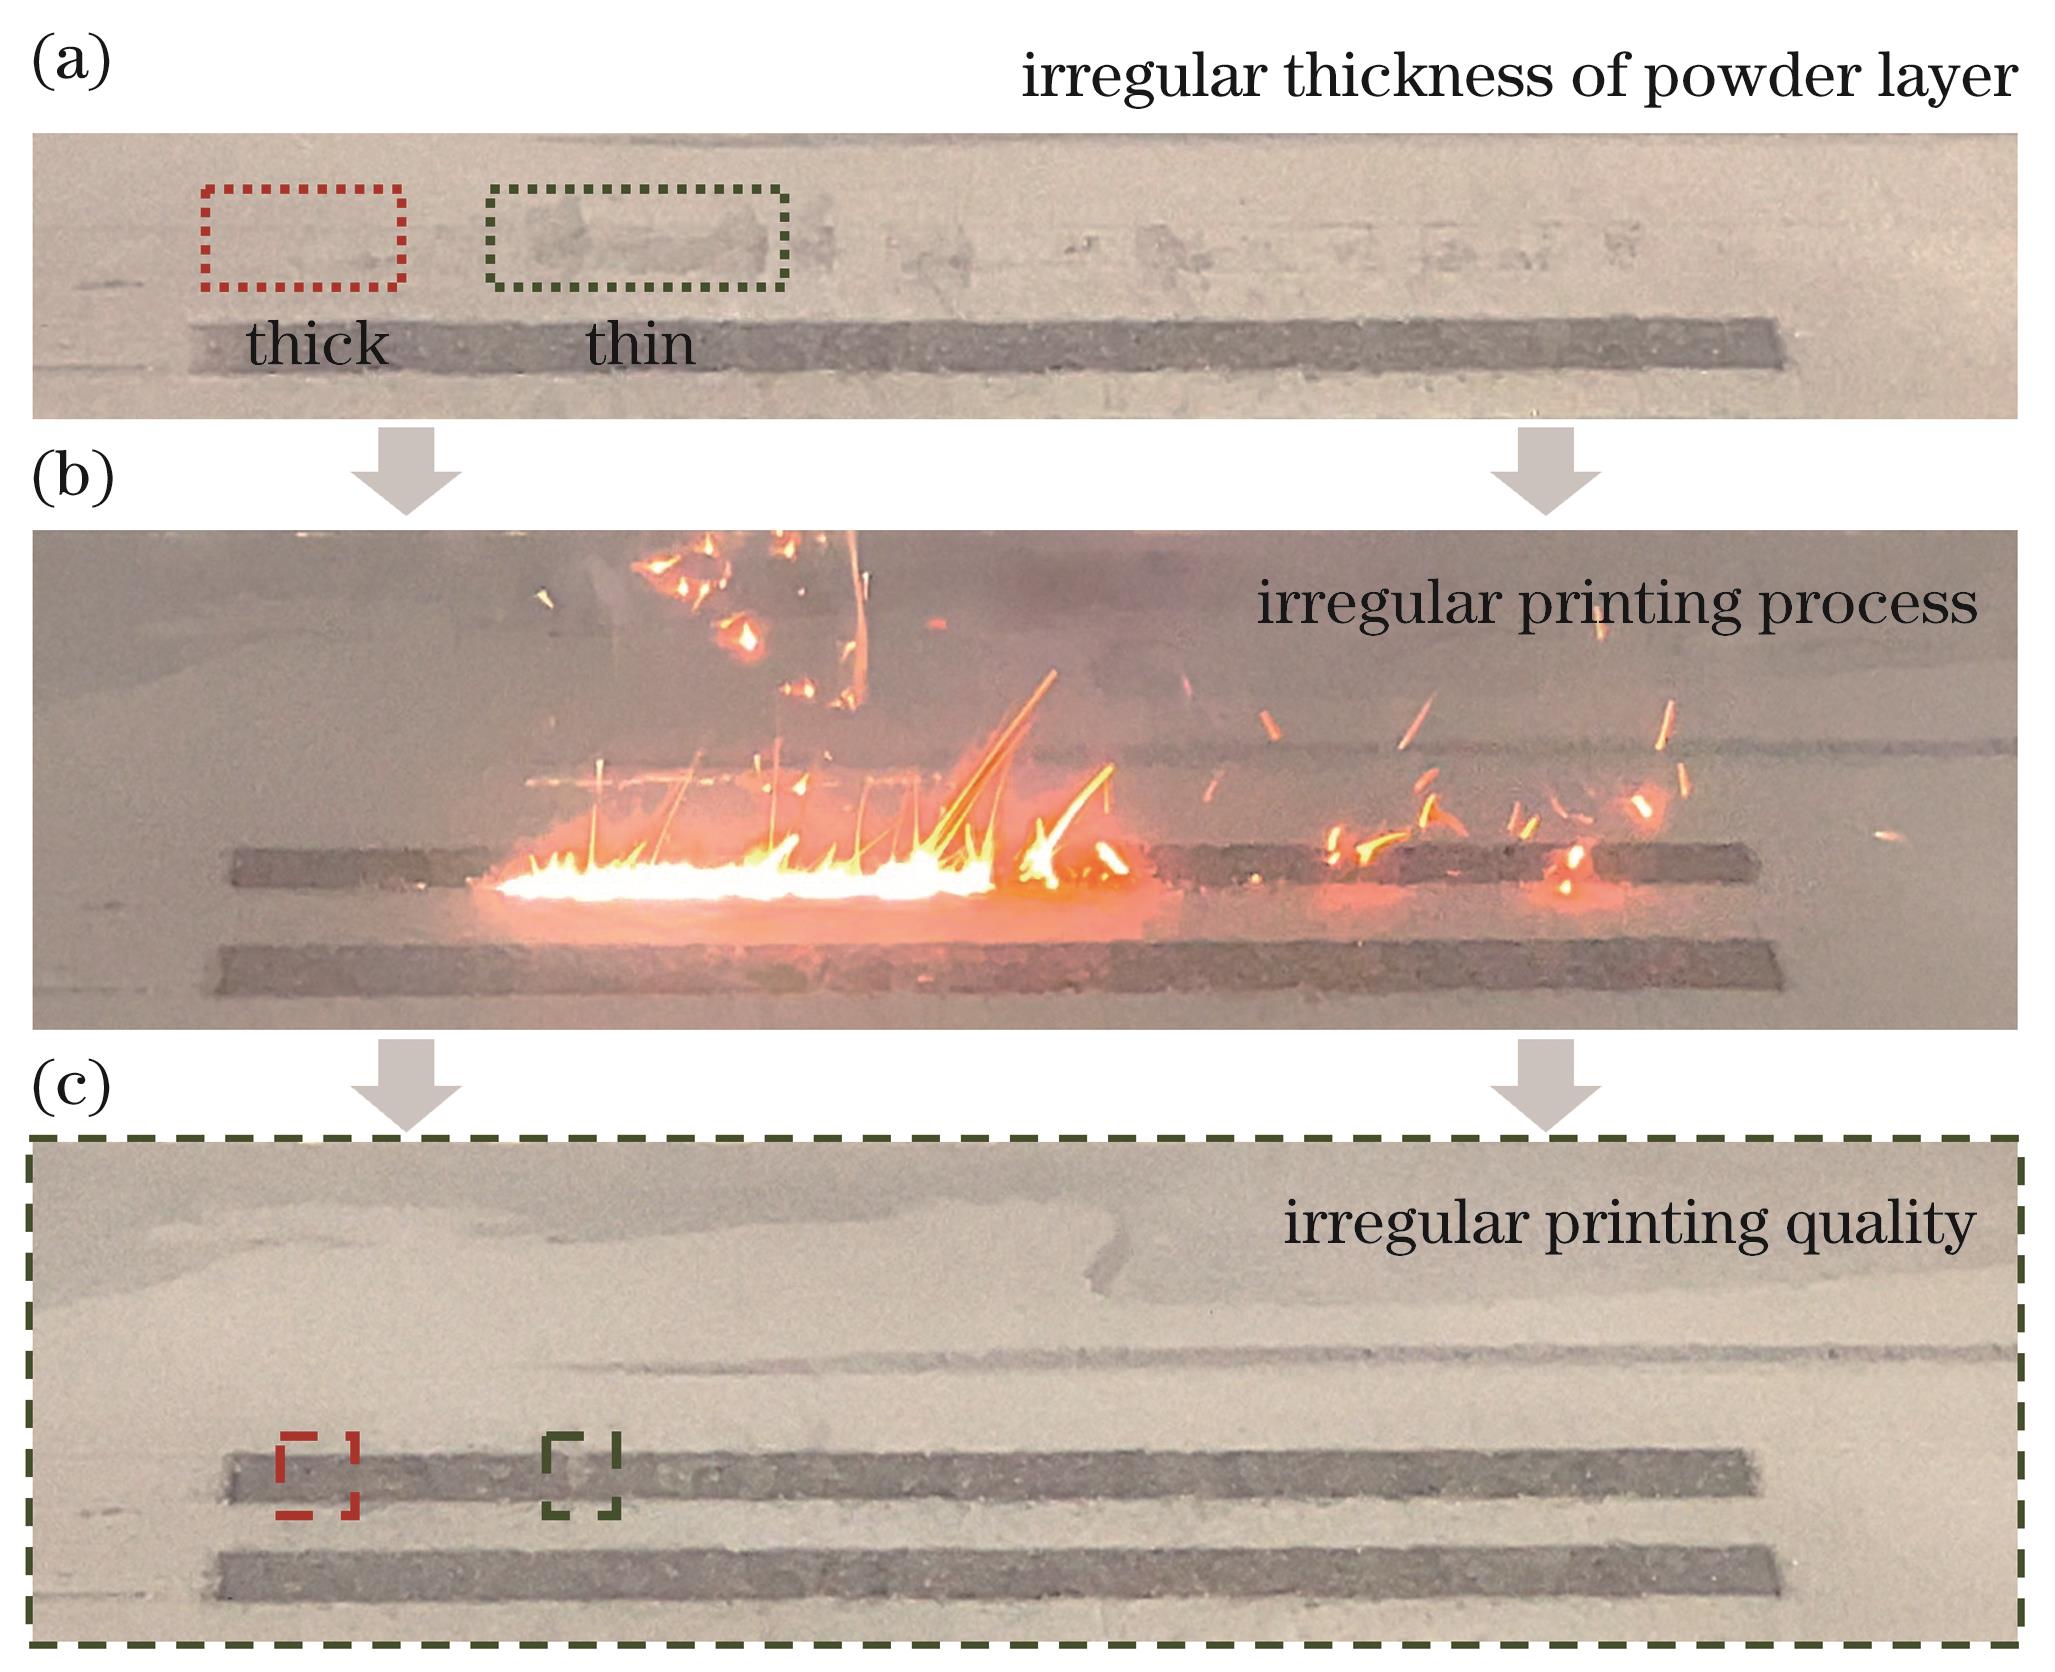
    Fig. 1. Deposition defects caused by powder spreading during printing. (a) Before printing; (b) during printing; (c) after printing
    In-situ monitoring system based on optical signals of melt pool
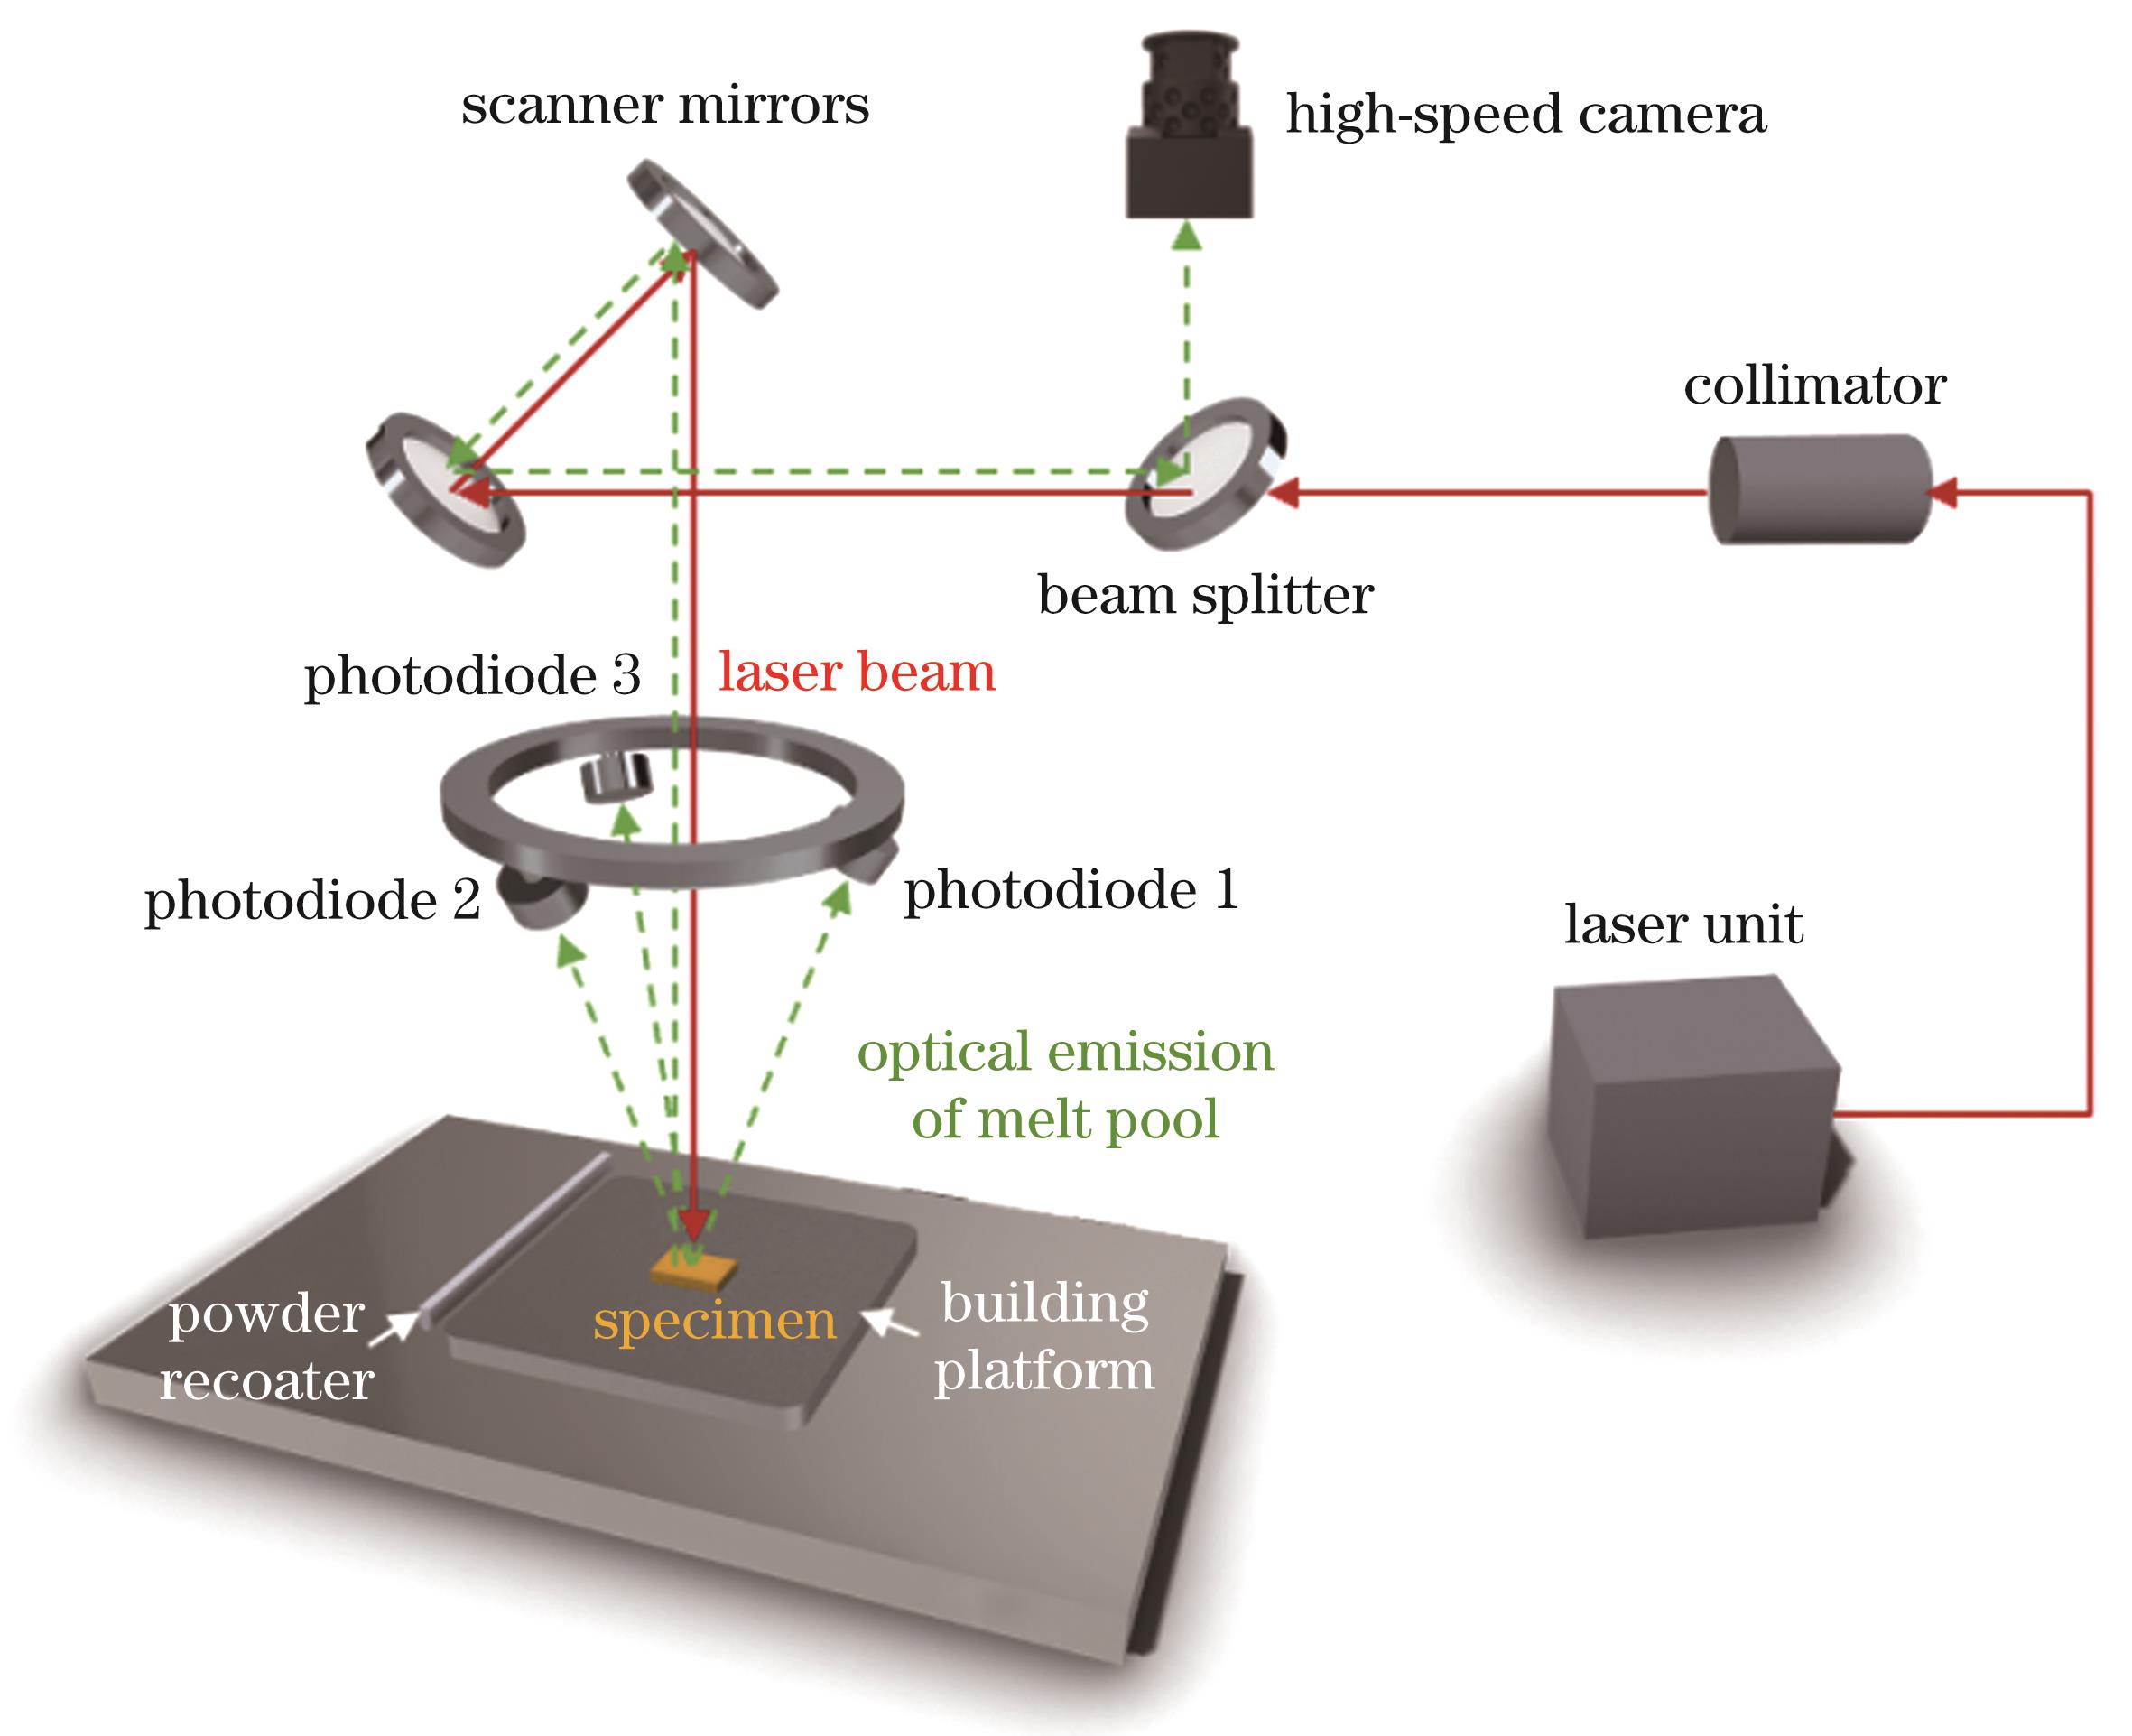
    Fig. 2. In-situ monitoring system based on optical signals of melt pool
    Morphology and particle size of AlSi10Mg alloy powder. (a) SEM morphology of powder; (b) particle size distribution
    Fig. 3. Morphology and particle size of AlSi10Mg alloy powder. (a) SEM morphology of powder; (b) particle size distribution
    Schematics of experimental model. (a) Pre-processed substrate by milling; (b) single-layer printing after powder spreading process
    Fig. 4. Schematics of experimental model. (a) Pre-processed substrate by milling; (b) single-layer printing after powder spreading process
    Spatial distributions of optical signals for melt pool of Group B samples. (a) Melt pool light intensity; (b) melt pool area
    Fig. 5. Spatial distributions of optical signals for melt pool of Group B samples. (a) Melt pool light intensity; (b) melt pool area
    Statistical results of melt pool light intensity under different process parameters. (a) Mean values under different laser powers; (b) mean values under different scanning speeds; (c) coefficients of variation under different laser powers; (d) coefficients of variation under different scanning speeds
    Fig. 6. Statistical results of melt pool light intensity under different process parameters. (a) Mean values under different laser powers; (b) mean values under different scanning speeds; (c) coefficients of variation under different laser powers; (d) coefficients of variation under different scanning speeds
    Statistical results of melt pool area under different process parameters. (a) Mean values under different laser powers; (b) mean values under different scanning speeds; (c) coefficients of variation under different laser powers; (d) coefficients of variation under different scanning speeds
    Fig. 7. Statistical results of melt pool area under different process parameters. (a) Mean values under different laser powers; (b) mean values under different scanning speeds; (c) coefficients of variation under different laser powers; (d) coefficients of variation under different scanning speeds
    Surface roughness measurement results and three-dimensional morphologies under different powder thickness conditions. Three-dimensional morphologies of Group B samples when powder thickness is (a) 30, (b) 90, (c) 150, (d) 210, and (e) 270 μm;(f) relationship between surface roughness and powder thickness under different laser process parameters
    Fig. 8. Surface roughness measurement results and three-dimensional morphologies under different powder thickness conditions. Three-dimensional morphologies of Group B samples when powder thickness is (a) 30, (b) 90, (c) 150, (d) 210, and (e) 270 μm;(f) relationship between surface roughness and powder thickness under different laser process parameters
    SEM images of surface morphologies and enlarged images. (a) Relationship between surface deposition defects and powder thickness under different laser process parameters; (b)‒(e) enlarged images of areas in dotted boxes
    Fig. 9. SEM images of surface morphologies and enlarged images. (a) Relationship between surface deposition defects and powder thickness under different laser process parameters; (b)‒(e) enlarged images of areas in dotted boxes
    Relationship between melt pool size and internal pore defect under different powder thicknesses. (a) Cross-sectional morphologies of samples after polishing and corrosion; (b)‒(f) locally magnified images
    Fig. 10. Relationship between melt pool size and internal pore defect under different powder thicknesses. (a) Cross-sectional morphologies of samples after polishing and corrosion; (b)‒(f) locally magnified images
    Relationship between melt pool intensity and melt pool area. (a) Good quality; (b) remediable quality; (c) high risk with deposition defects
    Fig. 11. Relationship between melt pool intensity and melt pool area. (a) Good quality; (b) remediable quality; (c) high risk with deposition defects
    ROC curve analysis under different thresholds. (a) 0.18 V; (b) 0.21 V; (c) 0.25 V; (d) 0.29 V
    Fig. 12. ROC curve analysis under different thresholds. (a) 0.18 V; (b) 0.21 V; (c) 0.25 V; (d) 0.29 V
    Distributions of abnormal monitoring signals of test samples when small threshold is 0.21 V. (a) Samples under different laser powers and powder thicknesses; (b) samples under different scanning speeds and powder thicknesses
    Fig. 13. Distributions of abnormal monitoring signals of test samples when small threshold is 0.21 V. (a) Samples under different laser powers and powder thicknesses; (b) samples under different scanning speeds and powder thicknesses
    Data set

    Laser power

    P /W

    Scanning speed v /

    (mm·s-1

    Hatch space

    h /μm

    A240100090
    B200100090
    C160100090
    D20080090
    E200120090
    Table 1. Experimental process parameters

    Powder

    thickness /μm

    Proportion of abnormal signals /%

    Laser power

    of 240 W

    and scanning speed

    of 1000 m/s

    Laser power

    of 200 W

    and scanning speed

    of 1000 m/s

    Laser power

    of 160 W

    and scanning speed

    of 1000 m/s

    Scanning speed

    of 800 mm·s-1

    and laser power

    of 200 W

    Scanning speed

    of 1200 mm·s-1

    and laser power

    of 200 W

    3000.2417.900.080
    600.271.2354.151.010.04
    901.104.4842.956.210.04
    1203.968.9055.4012.742.17
    15013.4921.4966.3223.4711.44
    18020.7035.7974.6028.2222.19
    21029.0557.7878.0435.0963.85
    24033.7372.5177.2748.8675.02
    27040.0580.5277.0157.9277.45
    30040.5058.6977.7359.2053.47
    Table 2. Proportions of abnormal signals in test samples
    Xiangyuan Chen, Huiliang Wei, Tingting Liu, Kai Zhang, Jiansen Li, Zhiyong Zou, Wenhe Liao. In‑Situ Monitoring and Diagnostics for Deposition Defects in Laser Powder Bed Fusion Process Based on Optical Signals of Melt Pool (Invited)[J]. Chinese Journal of Lasers, 2024, 51(10): 1002308
    Download Citation