
Zi-Qian Yang, Rui Ma, Shi-Jie Cheng, Meng Zhan. Problems and challenges of power-electronic-based power system stability: A case study of transient stability comparison [J]. Acta Physica Sinica, 2020, 69(8): 088907-1
- Acta Physica Sinica
- Vol. 69, Issue 8, 088907-1 (2020)
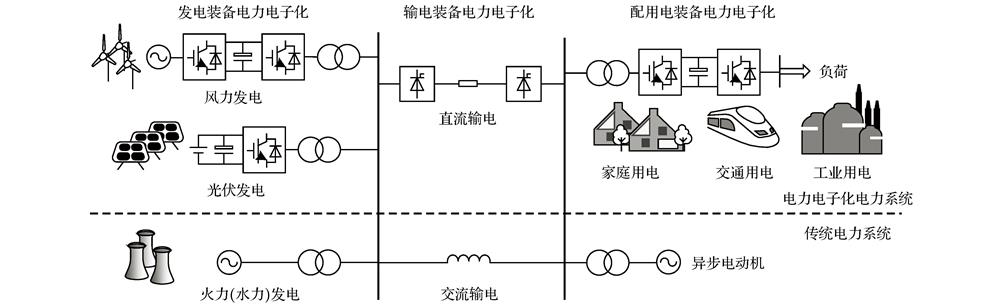
Fig. 1. Schematic diagram of power electronic dominated power systems
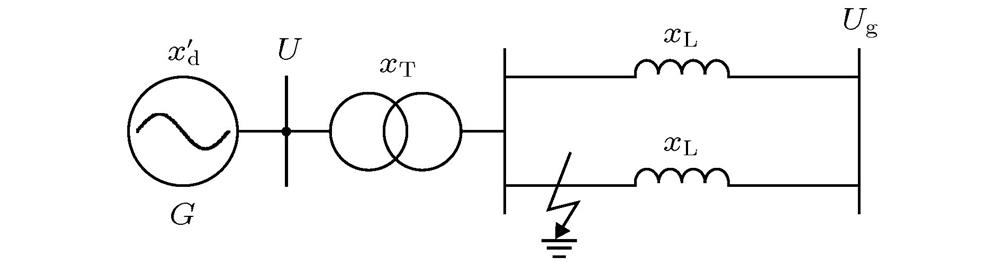
Fig. 2. Schematic show for a single-machine-infinite-bus (SMIB) system
Fig. 3. Power-angle relationship[7].
Fig. 4. (a) Power-angle relationships for three different states of before-fault (
 ), during-fault (
 ), and post-fault (
 ); (b) time-domain responses of the power angle when the system are stable (red curve) and critical stable (blue curve), respectively[9]
), during-fault (
), and post-fault (
); (b) time-domain responses of the power angle when the system are stable (red curve) and critical stable (blue curve), respectively[9] Fig. 5. (a) Potential energy function curve; (b) trajectories in state space corresponding different states: stable, critically stable, and unstable[10].
Fig. 6. Schematic show of a grid-connected VSC system and its controllers
Fig. 7. Schematic show of the control diagram of the VSC system within the voltage timescale
Fig. 8. Bifurcation diagram with the variation of
 including a sub-critical Hopf bifurcation and a generalized saddle-node bifurcation. The sub-figure shows the eigenvalue traces when
 decreases and passes through the Hopf bifurcation point
including a sub-critical Hopf bifurcation and a generalized saddle-node bifurcation. The sub-figure shows the eigenvalue traces when
decreases and passes through the Hopf bifurcation point Fig. 9. Response comparison between the voltage timescale VSC system and the detailed VSC system after transient fault
Fig. 10. (a) A multi-machine power system with VSC devices and synchronous generators and (b) its variable relations in differential algebraic equations
|
Table 1. Comparison of transient problems between Power-electronic-based power systems and traditional power systems

Set citation alerts for the article
Please enter your email address
© Copyright 2018-2021 | Chinese Laser Press. All Rights Reserved 沪ICP备15018463号-20