Author Affiliations
1School of Resource and Environmental Science, Wuhan University, Wuhan 430079, China1武汉大学资源与环境科学学院,武汉 4300792Key Laboratory of Geographic Information Systems, Ministry of Education, Wuhan University, Wuhan 430079, China2武汉大学地理信息系统教育部重点实验室,武汉 4300793Appraisal Center for Environment and Engineering, Ministry of Ecology and Environment, Beijing 100012, China3生态环境部环境工程评估中心,北京100012show less
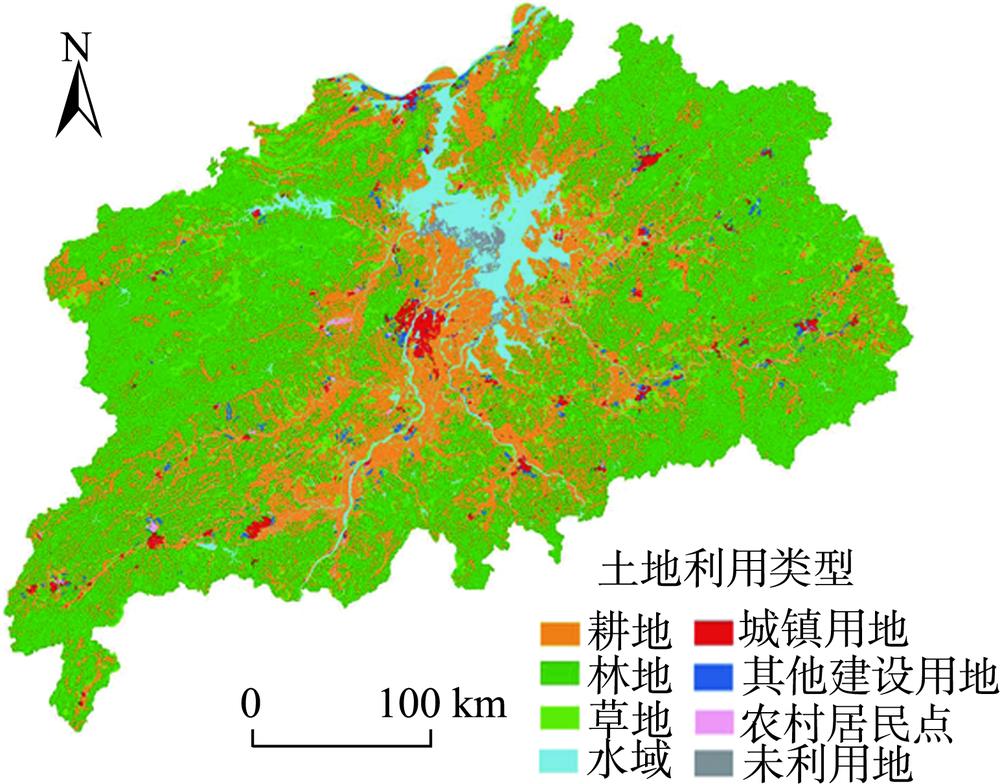
Fig. 1. Land use status of the city clusters around Poyang Lake
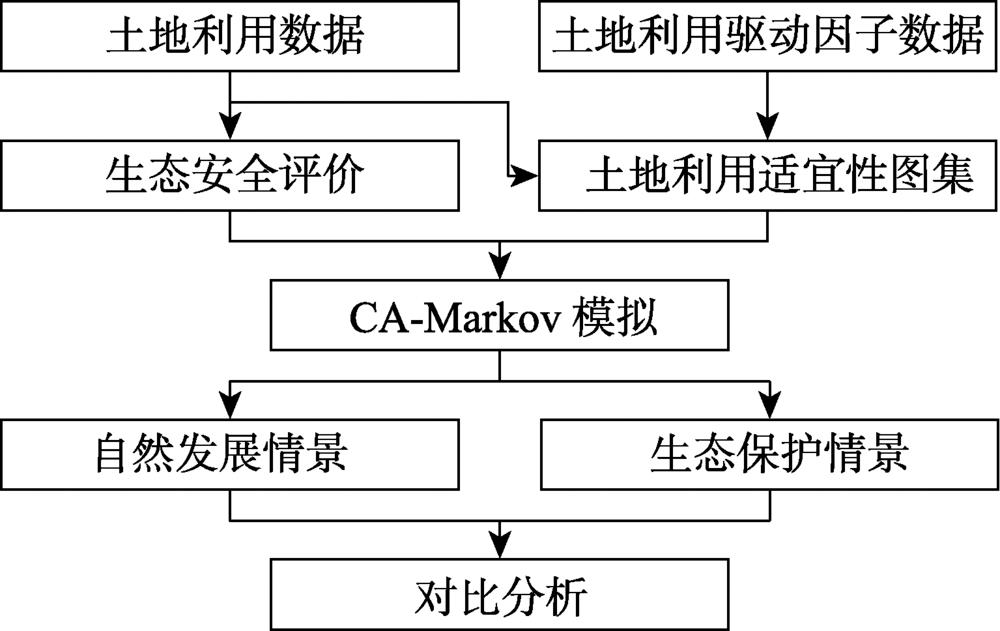
Fig. 2. Technical flowchart of land use simulation in the city clusters around Poyang Lake
Fig. 3. Land ecological security patterns in the city clusters around Poyang Lake in 2005, 2010 and 2015
Fig. 4. Changes of the land ecological security patterns in the city clusters around Poyang Lake from 2005 to 2015
Fig. 5. Suitability of each land use type in the city clusters around Poyang Lake from 2005 to 2010
Fig. 6. Suitability of each land use type in the city clusters around Poyang Lake from 2010 to 2015
Fig. 7. Suitability of the lands for constructing towns and other construction purposes under the ecological protection scenario in the city clusters around Poyang Lake from 2010 to 2015
Fig. 8. Land use simulation result in the city clusters around Poyang Lake in 2015
Fig. 9. Land use simulations of the city clusters around Poyang Lake in 2030 under the two scenarios
Fig. 10. Changes of the lands for constructing towns and other construction purposes in the city clusters around Poyang Lake in 2030 under the two scenarios
Fig. 11. Land ecological security patterns under the two scenarios in the city clusters around Poyang Lake in 2030
Fig. 12. Changes of land ecological security patterns under the two scenarios in the city clusters around Poyang Lake from 2015 to 2030
因素 | 生态景观结构 | 生态功能 | 生态干扰度 | 生态恢复力 |
---|
生态景观结构 | 1 | 1 | 2 | 2 | 生态功能 | 1 | 1 | 3 | 3 | 生态干扰度 | 1/2 | 1/3 | 1 | 1 | 生态恢复力 | 1/2 | 1/3 | 1 | 1 |
|
Table 1. Analytic hierarchy process judgment matrix of land ecological security assessment index in the city clusters around Poyang Lake
目标层 | 项目层 | 指标层 | 正/负向 | 权重 |
---|
土地生态安全 | 生态景观结构 | 景观形状指数 | 正 | 0.167 | 蔓延度指数 | 正 | 0.032 | 分离度指数 | 负 | 0.018 | 香农均匀度指数 | 正 | 0.103 | 生态功能 | 生态系统服务价值 | 正 | 0.391 | 生态干扰度 | 建设用地面积 | 负 | 0.144 | 生态恢复力 | 生态弹性度 | 正 | 0.144 |
|
Table 2. Land ecological security assessment index in the city clusters around Poyang Lake
变量类型 | 变量 | 说明 |
---|
社会经济因素 | 地均GDP | 期初GDP空间数据 | 人口 | 期初人口空间数据 | 城市流强度 | 期初城市流强度,根据参考文献公式及统计数据进行计算 | 自然因素 | DEM | — | 坡度 | 根据DEM数据进行计算 | 邻域因素 | 距道路距离 | 距道路的最近距离 | 距城镇距离 | 距期初城镇用地的最近距离 | 距农村距离 | 距期初农村居民点的最近距离 | 距水域距离 | 距期初水域的最近距离 |
|
Table 3. Potential driving factors of land use change in the city clusters around Poyang Lake
生态安全级别 | 2005年 | 2010年 | 2015年 |
---|
低生态安全 | 627.13 | 699.13 | 773.12 | 较低生态安全 | 2042.50 | 2186.50 | 2393.39 | 中等生态安全 | 13 679.37 | 13 771.99 | 14 599.22 | 较高生态安全 | 67 120.29 | 66 994.62 | 65 992.50 | 高生态安全 | 8421.97 | 8239.01 | 8133.03 |
|
Table 4. The areas of each land ecological security level inthe city clusters around Poyang Lakein 2005, 2010, and 2015 (km2)
约束因子/用地类型 | 耕地 | 林地 | 草地 | 水域 | 城镇用地 | 农村居民点 | 其他建设用地 | 未利用地 |
---|
地均GDP | — | 0.22(+) | 0.23(+) | — | — | 0.11(+) | — | — | 人口 | — | 0.53(-) | 0.25(-) | — | 0.03(+) | 0.10(-) | 0.05(+) | 0.21(-) | 城市流强度 | 0.20(+) | 0.11(+) | 0.04(+) | — | 0.03(+) | 0.03(+) | 0.15(-) | — | DEM | 0.08(-) | 0.05(+) | 0.24(-) | 0.54(-) | 0.07(+) | — | 0.13(-) | 0.21(-) | 坡度 | 0.24(-) | — | — | 0.04(-) | 0.02(-) | 0.23(-) | 0.15(-) | — | 距道路距离 | 0.10(+) | — | 0.05(+) | 0.02(+) | 0.09(-) | 0.20(-) | 0.31(-) | 0.01(+) | 距城镇距离 | 0.13(-) | 0.03(-) | 0.04(-) | 0.01(+) | 0.63(-) | 0.11(-) | 0.10(-) | 0.01(+) | 距农村距离 | 0.06(-) | 0.02(+) | 0.04(+) | 0.05(+) | 0.07(-) | 0.18(-) | 0.04(+) | 0.02(+) | 距水域距离 | 0.19(-) | 0.04(-) | 0.11(+) | 0.34(-) | 0.06(-) | 0.04(+) | 0.07(-) | 0.54(-) |
|
Table 5. Land use driving factors and weights in the city clusters around Poyang Lake from 2005 to 2010
约束因子/用地类型 | 耕地 | 林地 | 草地 | 水域 | 城镇用地 | 农村居民点 | 其他建设用地 | 未利用地 |
---|
地均GDP | 0.06(+) | 0.06(+) | — | 0.03(+) | 0.06(+) | — | 0.10(+) | 0.11(-) | 人口 | 0.05(-) | — | 0.83(-) | 0.05(-) | 0.01(-) | — | 0.09(-) | 0.09(-) | 城市流强度 | 0.08(-) | 0.46(-) | 0.10(-) | 0.07(-) | 0.02(-) | 0.16(-) | 0.01(-) | 0.23(-) | DEM | 0.34(-) | 0.11(-) | — | 0.50(-) | — | — | 0.08(-) | 0.39(-) | 坡度 | — | 0.08(+) | 0.03(-) | 0.02(+) | 0.04(-) | — | 0.06(-) | 0.03(-) | 距道路距离 | 0.09(+) | — | 0.03(-) | — | 0.41(-) | 0.21(-) | 0.26(-) | 0.03(-) | 距城镇距离 | 0.16(-) | 0.23(-) | — | 0.17(-) | 0.12(-) | — | 0.14(-) | 0.12(-) | 距农村距离 | 0.11(-) | 0.06(-) | 0.01(-) | 0.05(-) | 0.32(-) | 0.17(-) | 0.22(-) | — | 距水域距离 | 0.11(-) | — | — | 0.11(+) | 0.02(-) | 0.46(-) | 0.04(-) | — |
|
Table 6. Land use drivingfactors and weights in the city clusters around Poyang Lake from 2010 to 2015
年份 | 耕地 | 林地 | 草地 | 水域 | 城镇用地 | 农村居民点 | 其他建设用地 | 未利用地 |
---|
2015 | 29 436.48 | 49 326.36 | 2862.00 | 6163.59 | 987.81 | 1628.94 | 954.76 | 531.31 | 2030(预测) | 26 732.77 | 46 201.04 | 3158.22 | 6103.61 | 2683.32 | 1348.62 | 5172.59 | 491.08 |
|
Table 7. Land use areas in the city clusters around Poyang Lake in 2015 and 2030 (km2)
生态安全级别 | 自然发展情景 | 生态保护情景 |
---|
低生态安全 | 2137.83 | 2137.83 | 较低生态安全 | 5219.69 | 5543.69 | 中等生态安全 | 21 196.60 | 21 412.60 | 较高生态安全 | 58 588.10 | 56 176.11 | 高生态安全 | 4749.04 | 6621.03 |
|
Table 8. The areas of land in all ecological security levels under the two scenarios inthe city clusters around Poyang Lake in 2030 (km2)