• High Power Laser Science and Engineering
  • Vol. 4, Issue 1, 010000e8 (2016)
Yingxia Wei1, Yaoxiang Liu1, Tie-Jun Wang1, Na Chen1, Jingjing Ju1, Yonghong Liu1, Haiyi Sun1, Cheng Wang1, Jiansheng Liu1, Haihe Lu1, See Leang Chin2, and Ruxin Li1
Author Affiliations
  • 1State Key Laboratory of High Field Laser Physics, Shanghai Institute of Optics and Fine Mechanics, Chinese Academy of Sciences, China
  • 2Centre d’Optique, Photonique et Laser (COPL) and D′epartement de physique, de g′enie physique et d’optique, Universit′e Laval, Qu′ebec, Qu′ebec G1V 0A6, Canada
  • show less
    DOI: 10.1017/hpl.2016.7 Cite this Article Set citation alerts
    Yingxia Wei, Yaoxiang Liu, Tie-Jun Wang, Na Chen, Jingjing Ju, Yonghong Liu, Haiyi Sun, Cheng Wang, Jiansheng Liu, Haihe Lu, See Leang Chin, Ruxin Li. Spectroscopic analysis of high electric field enhanced ionization in laser filaments in air for corona guiding[J]. High Power Laser Science and Engineering, 2016, 4(1): 010000e8 Copy Citation Text show less
    Real-color image of (a) a typical filament and (b) filament-guided CDs taken by a digital camera. The CD voltage and filamenting pulse energy were 50 kV and 5.4 mJ, respectively.
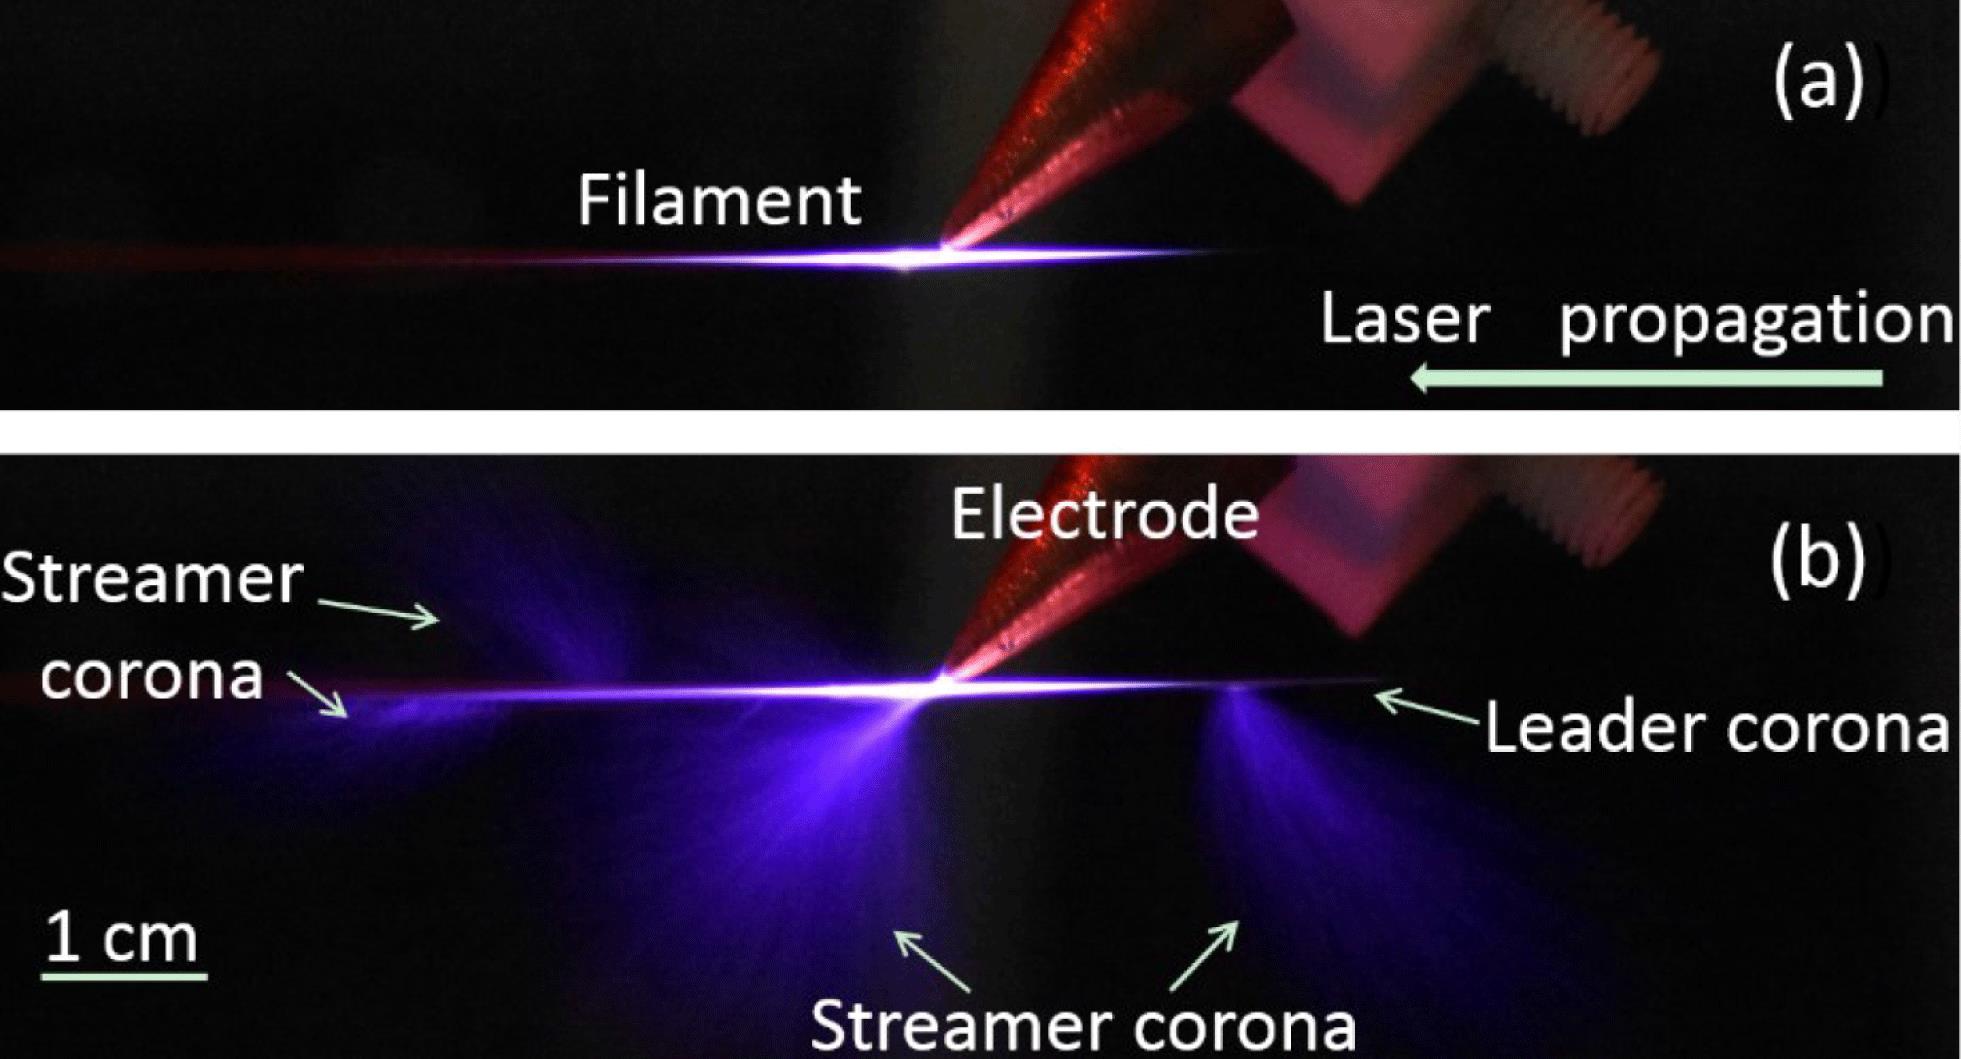
    Fig. 1. Real-color image of (a) a typical filament and (b) filament-guided CDs taken by a digital camera. The CD voltage and filamenting pulse energy were 50 kV and 5.4 mJ, respectively.
    Side schematic of the experimental setup for fluorescence detection in air. F1–F3 are focusing UV grade fused silica lenses with focal lengths of 30, 15 and 10 cm, respectively. E1 and E2 are electrodes. E1 was connected to a high-voltage power supply and E2 was floated. BD is a beam dump.
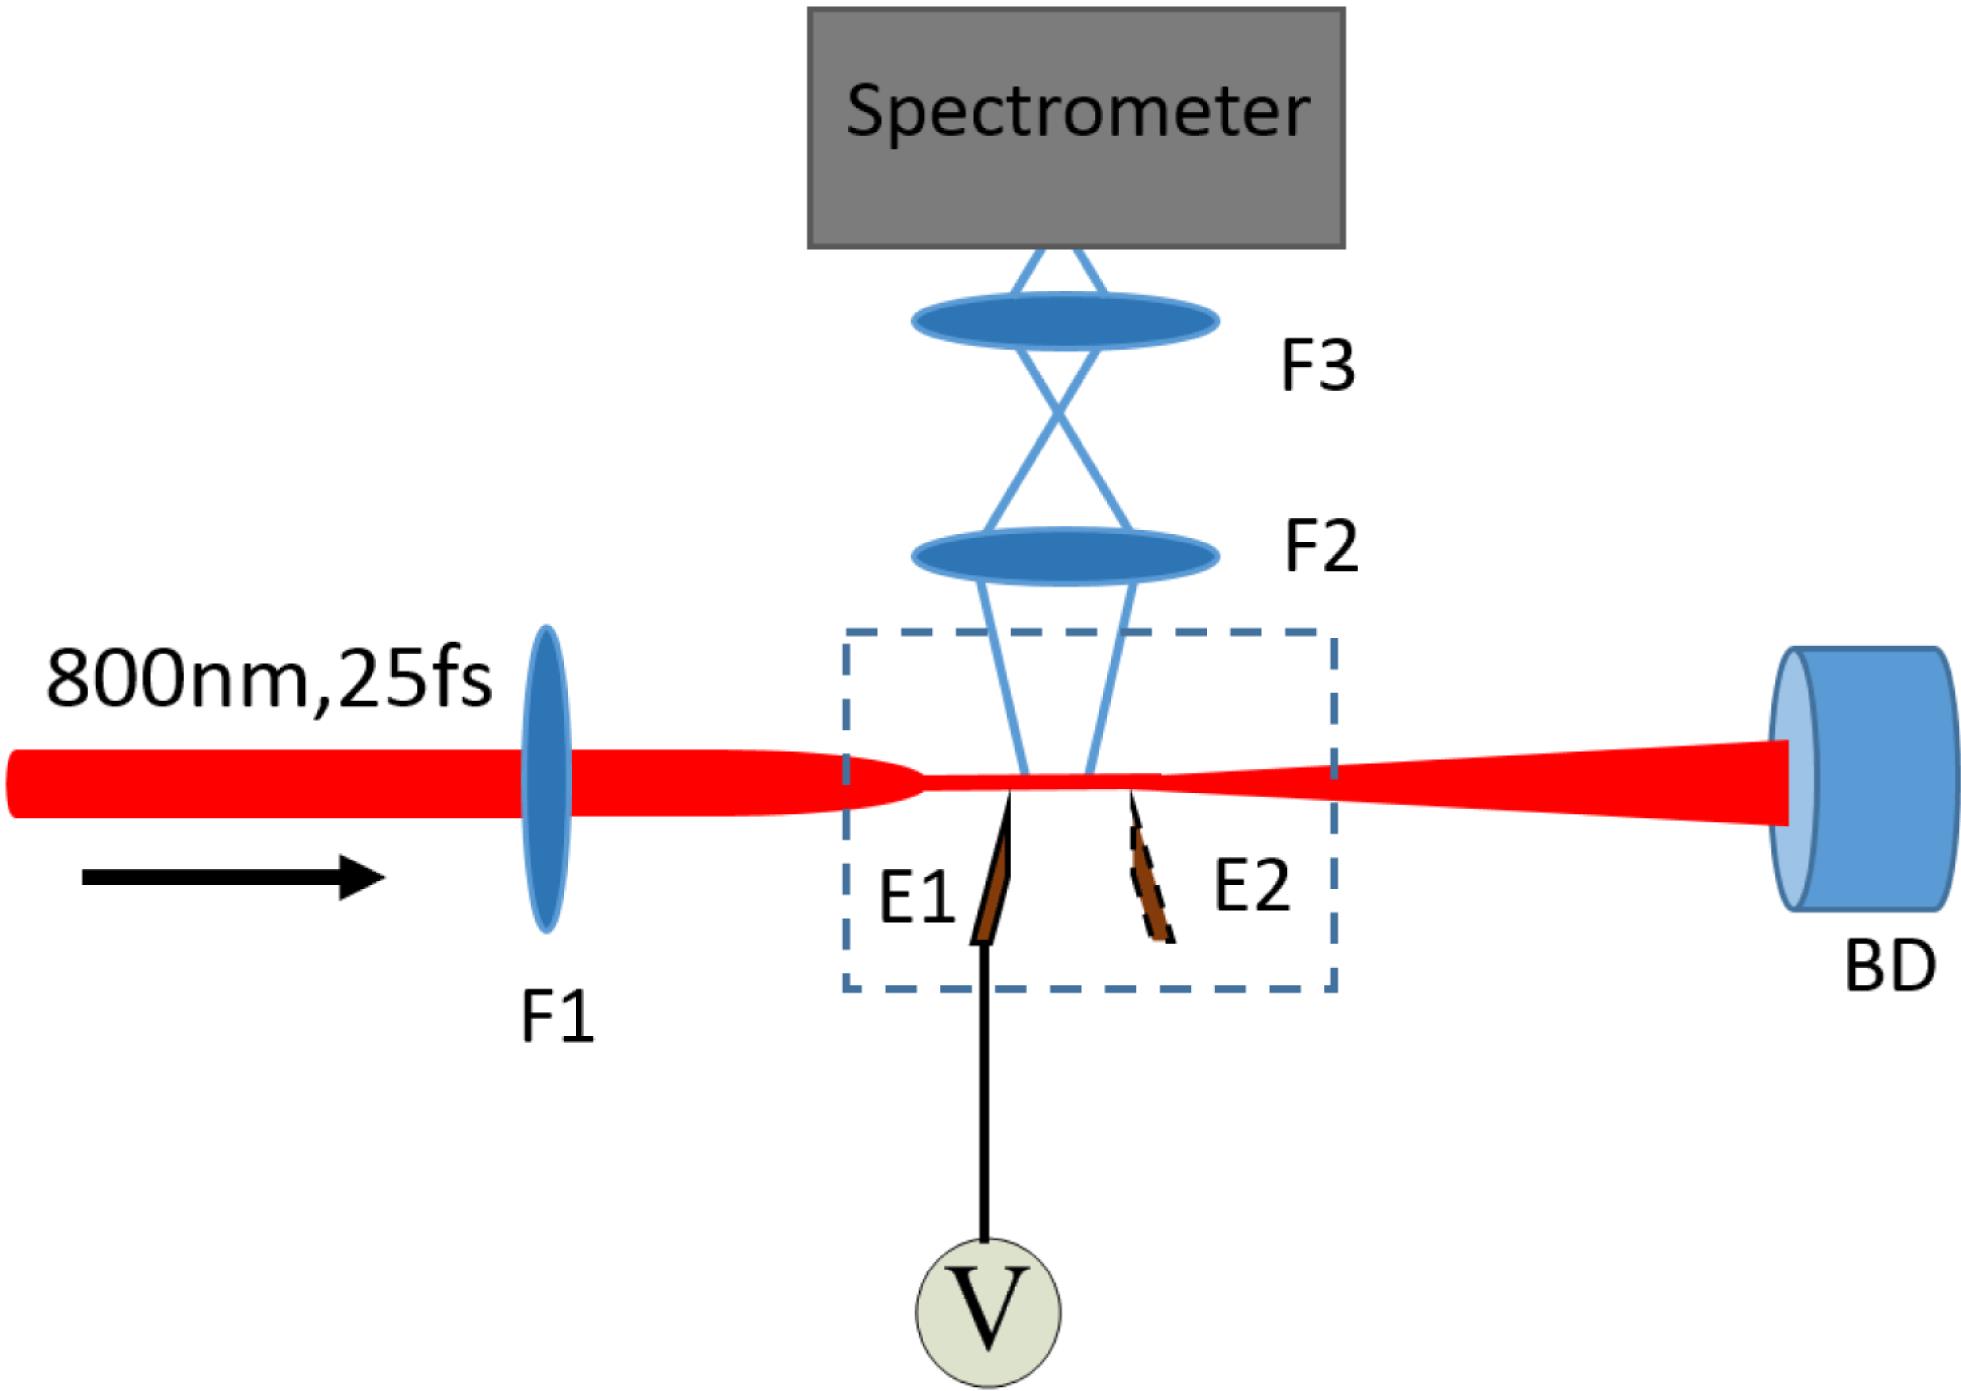
    Fig. 2. Side schematic of the experimental setup for fluorescence detection in air. F1–F3 are focusing UV grade fused silica lenses with focal lengths of 30, 15 and 10 cm, respectively. E1 and E2 are electrodes. E1 was connected to a high-voltage power supply and E2 was floated. BD is a beam dump.
    Laser-guided leader type of CD. (a) Image of the tips of the two electrodes and typical fluorescence images of (b) CD, (c) FIL and (d) eFIL. The separation distance of the two tips was ${\sim}15$ mm. The filamenting pulse energy was 4.8 mJ and the CD voltage was 50 kV. The fluorescence length of the filament was ${\sim}10$ mm. It was situated at approximately 1–2 mm above the tips of the electrodes.
    Fig. 3. Laser-guided leader type of CD. (a) Image of the tips of the two electrodes and typical fluorescence images of (b) CD, (c) FIL and (d) eFIL. The separation distance of the two tips was ${\sim}15$ mm. The filamenting pulse energy was 4.8 mJ and the CD voltage was 50 kV. The fluorescence length of the filament was ${\sim}10$ mm. It was situated at approximately 1–2 mm above the tips of the electrodes.
    Typical spectrum in the range (a) 290–440 nm (Ref. [37]) and (b) 500–1090 nm emitted by CD, FIL and eFIL, respectively. The intensity of CD fluorescence is magnified by 30 times in (b).
    Fig. 4. Typical spectrum in the range (a) 290–440 nm (Ref. [37]) and (b) 500–1090 nm emitted by CD, FIL and eFIL, respectively. The intensity of CD fluorescence is magnified by 30 times in (b).
    (a) Resultant spectral intensity as a function of the pulse energy at 337 and 428 nm. The CD voltage was fixed at 50 kV. (b) Pseudocolor plot of pump energy versus wavelength corresponding to (a). (c) Resultant spectral intensity as a function of CD voltage when the pulse energy was fixed at 4.61 mJ. (d) Pseudocolor plot of voltage versus wavelength corresponding to (c).
    Fig. 5. (a) Resultant spectral intensity as a function of the pulse energy at 337 and 428 nm. The CD voltage was fixed at 50 kV. (b) Pseudocolor plot of pump energy versus wavelength corresponding to (a). (c) Resultant spectral intensity as a function of CD voltage when the pulse energy was fixed at 4.61 mJ. (d) Pseudocolor plot of voltage versus wavelength corresponding to (c).
    (a) Spectrum in the range 700–900 nm at different CD voltages: 5, 20, 30 and 50 kV, respectively. (b) Integrated spectral intensity as a function of CD voltage. The integrated spectral range is from 745 to 855 nm. The filamenting pulse energy was fixed at 4.61 mJ.
    Fig. 6. (a) Spectrum in the range 700–900 nm at different CD voltages: 5, 20, 30 and 50 kV, respectively. (b) Integrated spectral intensity as a function of CD voltage. The integrated spectral range is from 745 to 855 nm. The filamenting pulse energy was fixed at 4.61 mJ.
    Yingxia Wei, Yaoxiang Liu, Tie-Jun Wang, Na Chen, Jingjing Ju, Yonghong Liu, Haiyi Sun, Cheng Wang, Jiansheng Liu, Haihe Lu, See Leang Chin, Ruxin Li. Spectroscopic analysis of high electric field enhanced ionization in laser filaments in air for corona guiding[J]. High Power Laser Science and Engineering, 2016, 4(1): 010000e8
    Download Citation