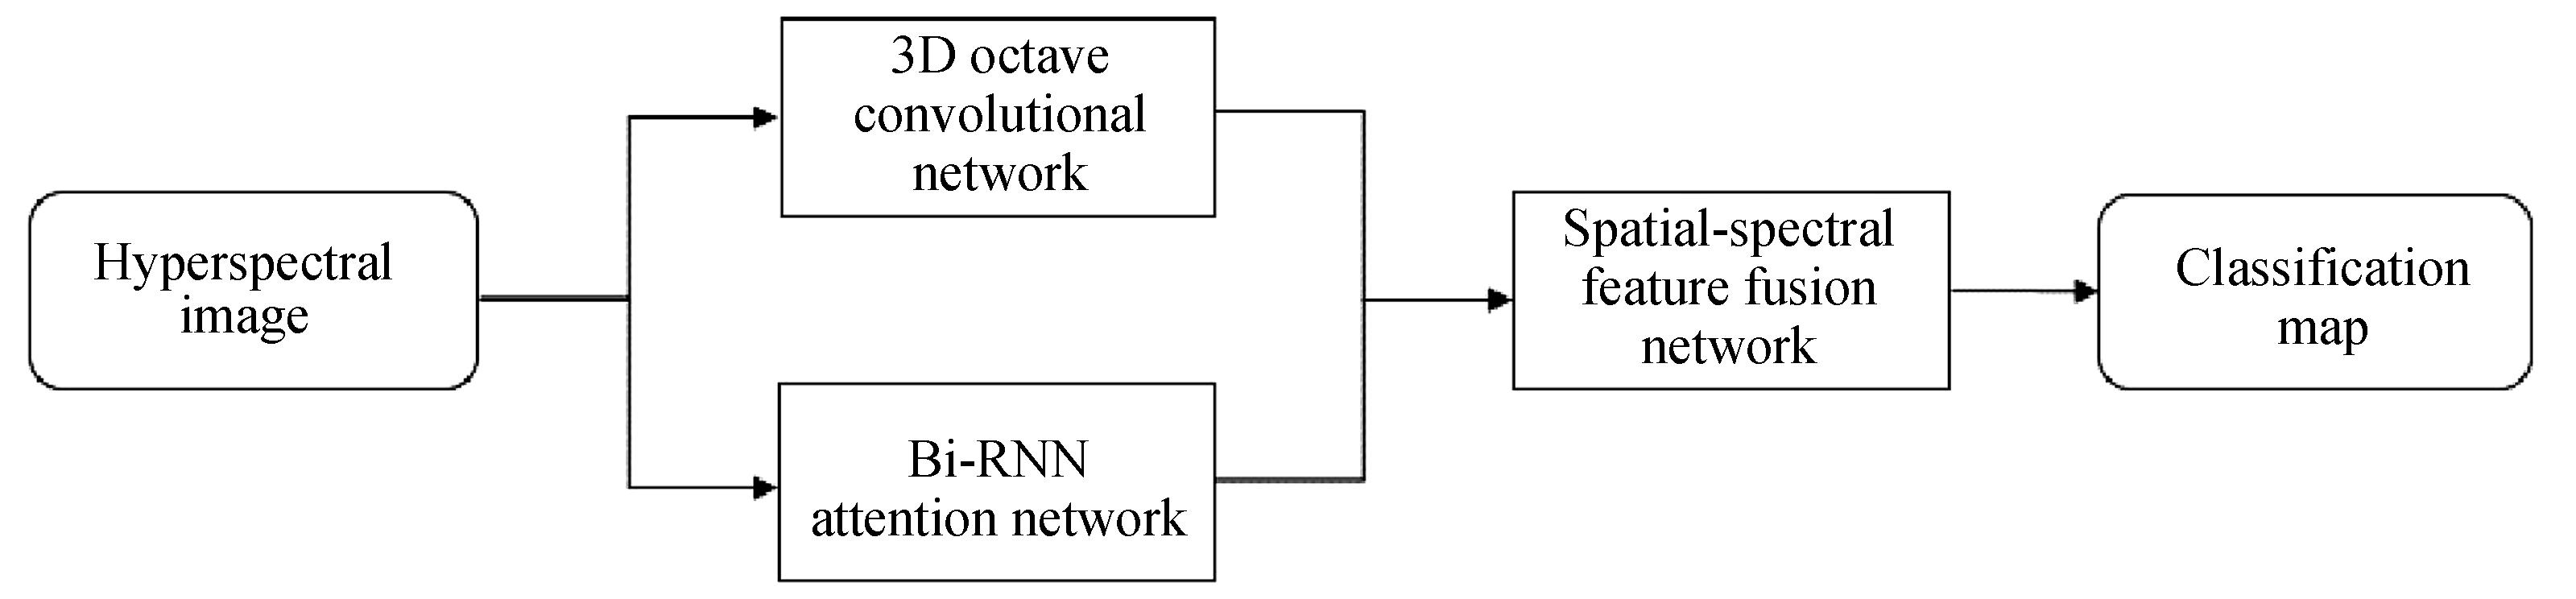
Fig. 1. Flow of framework for 3D Octave convolution and Bi-RNN attention network
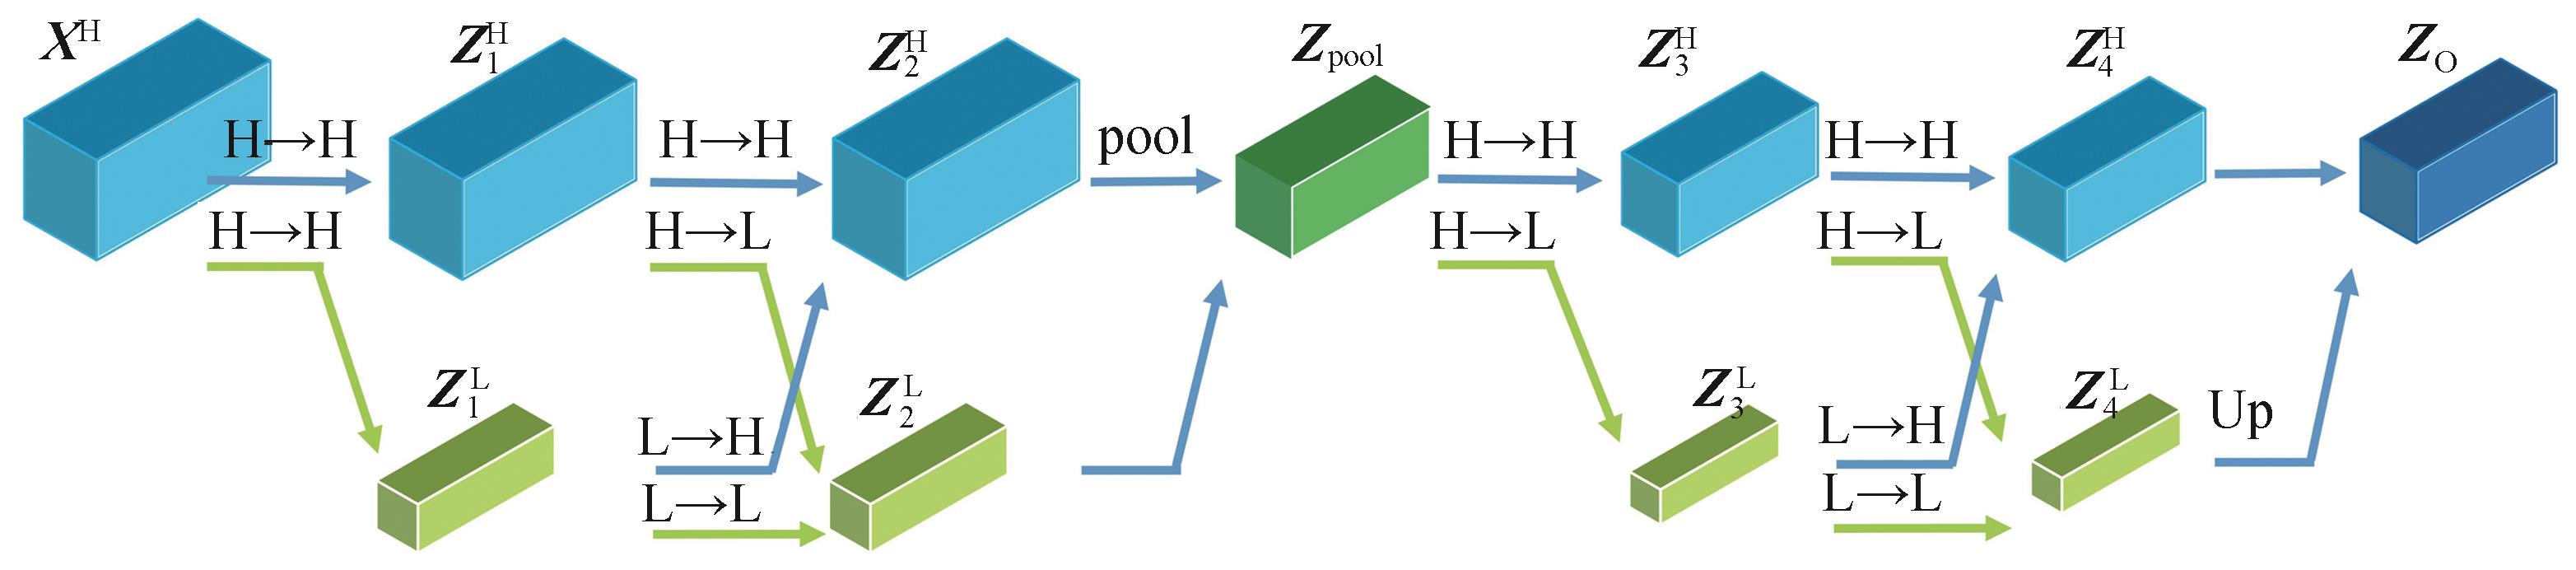
Fig. 2. Flow of 3D Octave convolution network
Fig. 3. Structure of Bi-RNN network
Fig. 4. Structure of Bi-RNN attention network
Fig. 5. The whole structure diagram of 3D Octave convolution and Bi-RNN attention network
Fig. 6. Classification maps of different methods on the Pavia University dataset
Fig. 7. Partial enlargement comparison of classification maps on the Pavia University dataset
Fig. 8. Classification maps of different methods on the Botswana dataset
Fig. 9. Partial enlargement comparison of classification maps on the Botswana dataset
Code | Class name | Train | Test | Total |
---|
Total | 3 930 | 38 846 | 42 776 | 1 | Asphalt | 548 | 6 083 | 6 631 | 2 | Meadows | 540 | 18 109 | 18 649 | 3 | Gravel | 392 | 1 707 | 2 099 | 4 | Trees | 542 | 2 522 | 3 064 | 5 | Painted metal sheets | 256 | 1 089 | 1 345 | 6 | Bare soil | 532 | 4 497 | 5 029 | 7 | Bitumen | 375 | 955 | 1 330 | 8 | Self-Blocking bricks | 514 | 3 168 | 3 682 | 9 | Shadows | 231 | 716 | 947 |
|
Table 1. Number of training and testing samples of the Pavia University dataset
Code | Class name | Train | Test | Total |
---|
Total | 420 | 2 828 | 3 248 | 1 | Water | 30 | 240 | 270 | 2 | Hippo grass | 30 | 71 | 101 | 3 | Floodplain grasses1 | 30 | 221 | 251 | 4 | Floodplain grasses1 | 30 | 185 | 215 | 5 | Reeds1 | 30 | 239 | 269 | 6 | Riparian | 30 | 239 | 269 | 7 | Firescar2 | 30 | 229 | 259 | 8 | Island interior | 30 | 173 | 203 | 9 | Acacia woodlands | 30 | 284 | 314 | 10 | Acacia shrublands | 30 | 218 | 248 | 11 | Acacia grasslands | 30 | 275 | 305 | 12 | Short mopane | 30 | 151 | 181 | 13 | Mixed mopane | 30 | 238 | 268 | 14 | Exposed soils | 30 | 65 | 95 |
|
Table 2. Number of training and testing samples of the Botswana dataset
| Spatial size |
---|
11![]() 11 | 13![]() 13 | 15![]() 15 | 17![]() 17 | 19![]() 19 | 21![]() 21 |
---|
Accuracy OA /% | 99.86 | 99.93 | 99.97 | 99.96 | 99.96 | 99.91 |
|
Table 3. Classification accuracy of different spatial size
| Dropout |
---|
0.2 | 0.3 | 0.4 | 0.5 | 0.6 | 0.7 | 0.8 | 0.9 |
---|
Accuracy OA /% | 99.82 | 99.87 | 99.91 | 99.94 | 99.97 | 99.96 | 99.96 | 99.95 |
|
Table 4. Classification accuracy of different dropout
Class | SVM | DBMA | ARNN | SSAN | 3DOC-SSAN | 3DOC-RNN |
---|
1 | 89.33 | 99.98 | 98.93 | 99.28 | 99.82 | 99.93 | 2 | 93.84 | 99.96 | 96.82 | 98.66 | 99.93 | 99.99 | 3 | 85.82 | 99.91 | 97.71 | 98.53 | 99.67 | 99.88 | 4 | 97.86 | 99.18 | 99.72 | 98.66 | 99.81 | 99.96 | 5 | 98.99 | 99.90 | 100.00 | 100.00 | 100.00 | 100.00 | 6 | 94.95 | 99.30 | 99.84 | 99.40 | 100.00 | 100.00 | 7 | 94.14 | 99.92 | 99.69 | 99.79 | 99.76 | 100.00 | 8 | 89.96 | 96.82 | 99.72 | 99.75 | 99.80 | 99.94 | 9 | 99.98 | 99.33 | 100.00 | 99.72 | 100.00 | 100.00 | OA/% | 93.12 | 99.52 | 98.23 | 99.00 | 99.87 | 99.97 | AA/% | 90.70 | 99.37 | 99.17 | 99.30 | 99.87 | 99.96 | Kappa/% | 93.88 | 99.35 | 97.59 | 98.64 | 99.94 | 99.96 |
|
Table 5. Classification performance of different methods on Pavia University dataset
Class | SVM | DBMA | ARNN | SSAN | 3DOC-SSAN |
---|
OA/% | +6.85 | +0.45 | +1.74 | +0.97 | +0.10 | AA/% | +9.26 | +0.59 | +0.79 | +0.66 | +0.09 | Kappa/% | +6.08 | +0.61 | +1.47 | +2.37 | +0.02 |
|
Table 6. Comparison with other methods in the classification accuracy difference on Botswana dataset
Class | SVM | DBMA | ARNN | SSAN | 3DOC-SSAN | 3DOC-RNN |
---|
1 | 100.00 | 98.94 | 99.60 | 99.19 | 100.00 | 100.00 | 2 | 100.00 | 100.00 | 100.00 | 100.00 | 100.00 | 100.00 | 3 | 98.19 | 100.00 | 99.13 | 99.15 | 100.00 | 97.38 | 4 | 96.76 | 99.03 | 88.89 | 100.00 | 100.00 | 100.00 | 5 | 76.15 | 98.81 | 84.62 | 85.49 | 96.65 | 100.00 | 6 | 74.48 | 98.73 | 99.19 | 98.39 | 97.91 | 99.58 | 7 | 95.63 | 100.00 | 97.05 | 100.00 | 100.00 | 100.00 | 8 | 98.84 | 100.00 | 100.00 | 99.45 | 100.00 | 99.94 | 9 | 85.21 | 100.00 | 98.97 | 96.56 | 100.00 | 100.00 | 10 | 89.91 | 100.00 | 94.74 | 100.00 | 100.00 | 100.00 | 11 | 95.27 | 100.00 | 100.00 | 100.00 | 100.00 | 100.00 | 12 | 92.05 | 100.00 | 100.00 | 100.00 | 98.01 | 100.00 | 13 | 88.24 | 100.00 | 100.00 | 100.00 | 100.00 | 100.00 | 14 | 100.00 | 100.00 | 97.14 | 95.38 | 100.00 | 100.00 | OA/% | 90.91 | 99.62 | 97.02 | 98.00 | 99.43 | 99.79 | AA/% | 90.14 | 99.67 | 97.10 | 98.12 | 99.47 | 99.81 | Kappa/% | 92.20 | 99.59 | 96.76 | 97.83 | 99.39 | 99.77 |
|
Table 7. Classification performance of different methods
Class | SVM | DBMA | ARNN | SSAN | 3DOC-SSAN |
---|
OA/% | +8.88 | +0.17 | +2.77 | +1.79 | +0.36 | AA/% | +9.67 | +0.14 | +2.71 | +1.69 | +0.34 | Kappa/% | +7.57 | +0.18 | +3.01 | +1.94 | +0.38 |
|
Table 8. Comparison with other methods in the classification accuracy difference on Botswana dataset
Class | 3D Octave | Bi-RNN | 3D-OCM | SSAM+SSICM |
---|
3DOC-RNN/s | 26.212 | 16.062 | — | — | 3DOC-SSAN/s | — | — | 26.635 | 0.766 9 |
|
Table 9. Comparison of the running time of the two methods