
Zhen Wang, Yan-Jun Du, Yan-Jun Ding, Zhi-Min Peng. Monitoring of ambient methane and carbon dioxide concentrations based on wavelength modulation-direct absorption spectroscopy [J]. Acta Physica Sinica, 2020, 69(6): 064205-1
- Acta Physica Sinica
- Vol. 69, Issue 6, 064205-1 (2020)
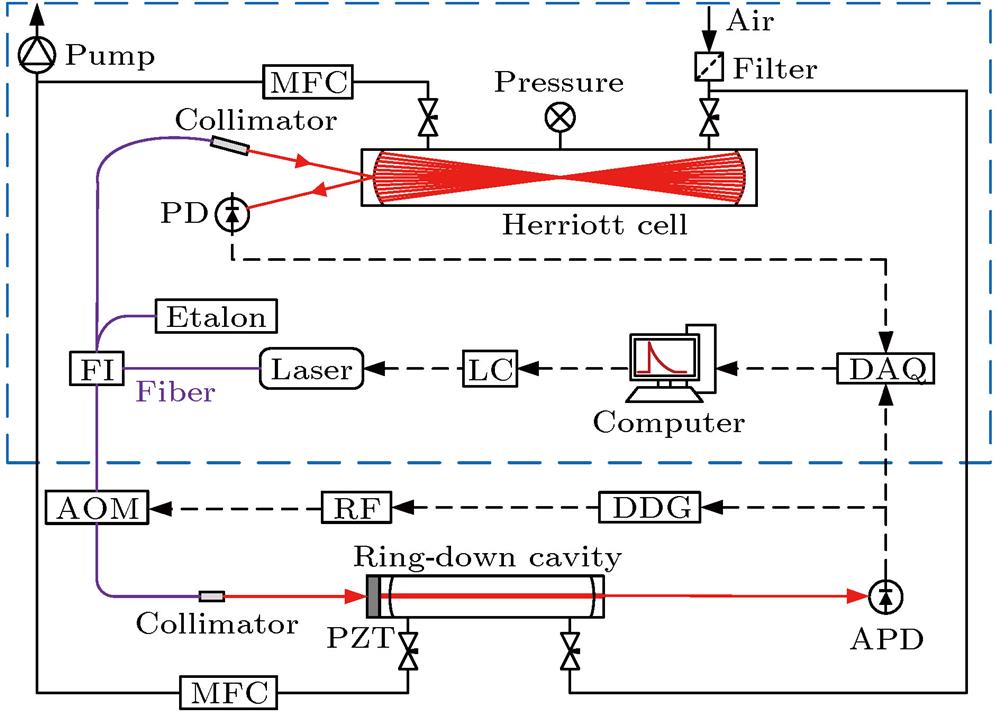
Fig. 1. System schematic diagram of WM-DAS and CW-CRDS. LC, laser current and temperature controller; FI, fiber isolator; AOM, acousto-optic modulator; APD, avalanche photodiode; PD, photodiode; DDG, digital delay generator; PZT, piezoelectric transducer; RF, radio frequency; DAQ, data acquisition system; WM, wavelength meter; MFC, mass flow controller.
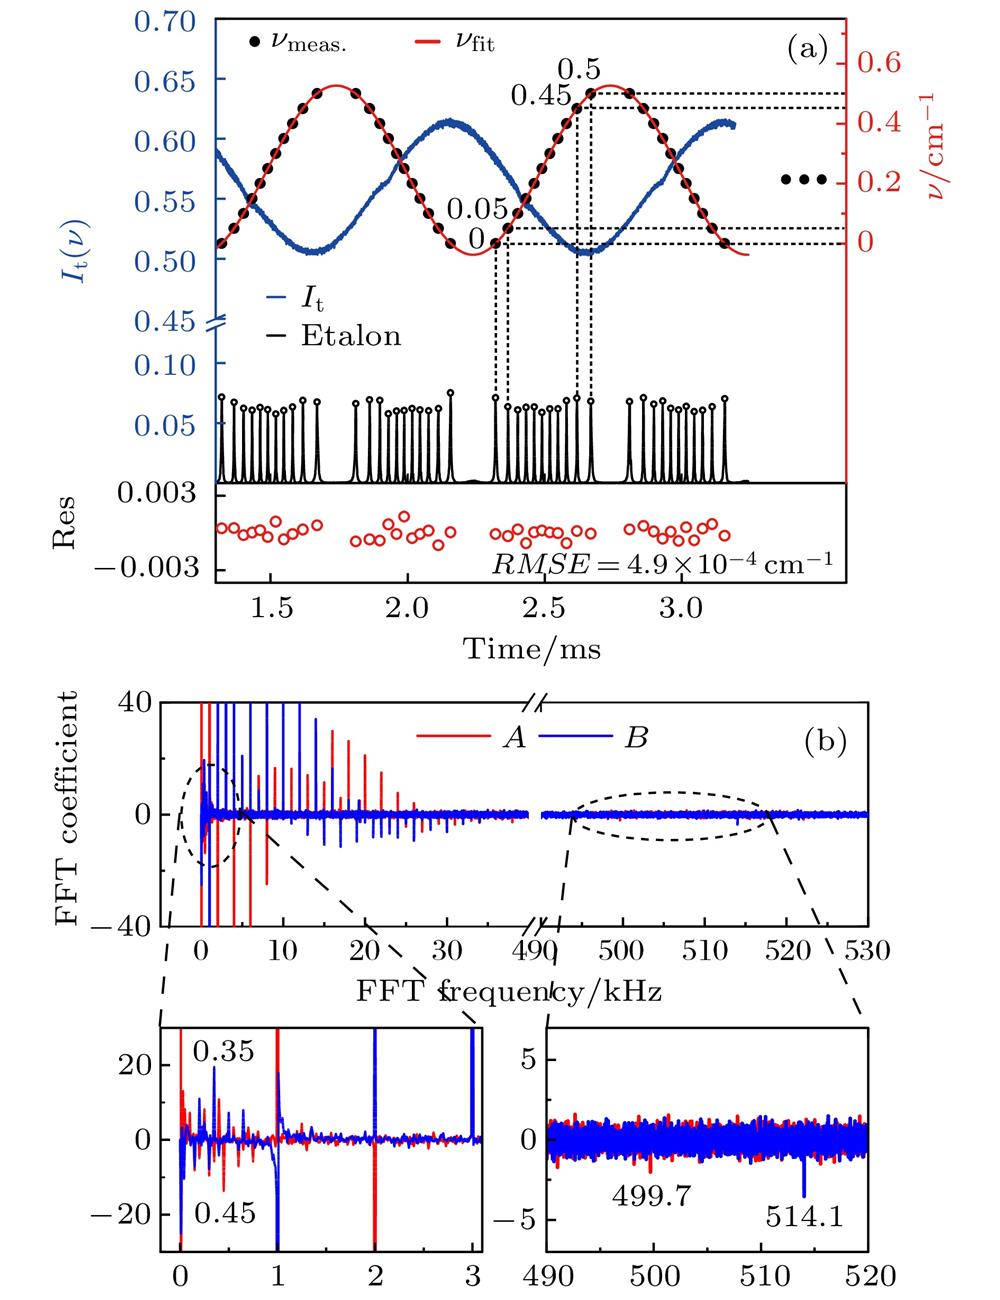
Fig. 2. Laser wavelength calibration and FFT filtering: (a) Etalon signal (black solid line), I t (blue solid circle), measured (black solid circle) and fitted relative frequency (red solid line), fitting residual (red hollow circle); (b) real part and imaginary part of Fourier coefficients of I t, and low frequency (0.35, 0.45 kHz) and high frequency (499.7, 514.1 kHz) noise.
Fig. 3. Absorption spectra of CO2 (red) and CH4 (blue) measured by WM-DAS in about 1 s at 298 K and 100.9 kPa, and the best fit of Voigt profile. In order to compare with CW-CRDS, the absorptance is converted to absorption coefficient (cm–1).
Fig. 4. The absorption spectra of CO2 (red) and CH4 (blue) measured by CRDS in about 24 min at 298 K and 100.9 kPa: (a) The relationship between the ring down time and the current; (b) the absorption function and the best fits of Voigt profile.
Fig. 5. (a) Comparison of measuring range of CH4 between the two methods; (b) histograms of two methods at different concentrations of CH4.
Fig. 6. Time sequence diagram of WM-DAS and CW-CRDS, laser current (black solid line), transmitted light I t (blue solid line), ring down time (red solid line).
Fig. 7. (a) CO2 in atmosphere measured by the two methods; (b) linear fitting of the data measured by the two methods.
Fig. 8. (a) CH4 in atmosphere measured by the two methods; (b) linear fitting of the data measured by the two methods.
Fig. 9. Allan variance measured by the two methods: (a) CO2; (b) CH4.

Set citation alerts for the article
Please enter your email address
© Copyright 2018-2021 | Chinese Laser Press. All Rights Reserved 沪ICP备15018463号-20