
Weiping Wang, Yidong Tan, Shulian Zhang, Yan Li. Microstructure measurement based on frequency-shift feedback in a-cut Nd:YVO4 laser[J]. Chinese Optics Letters, 2015, 13(12): 121201
- Chinese Optics Letters
- Vol. 13, Issue 12, 121201 (2015)
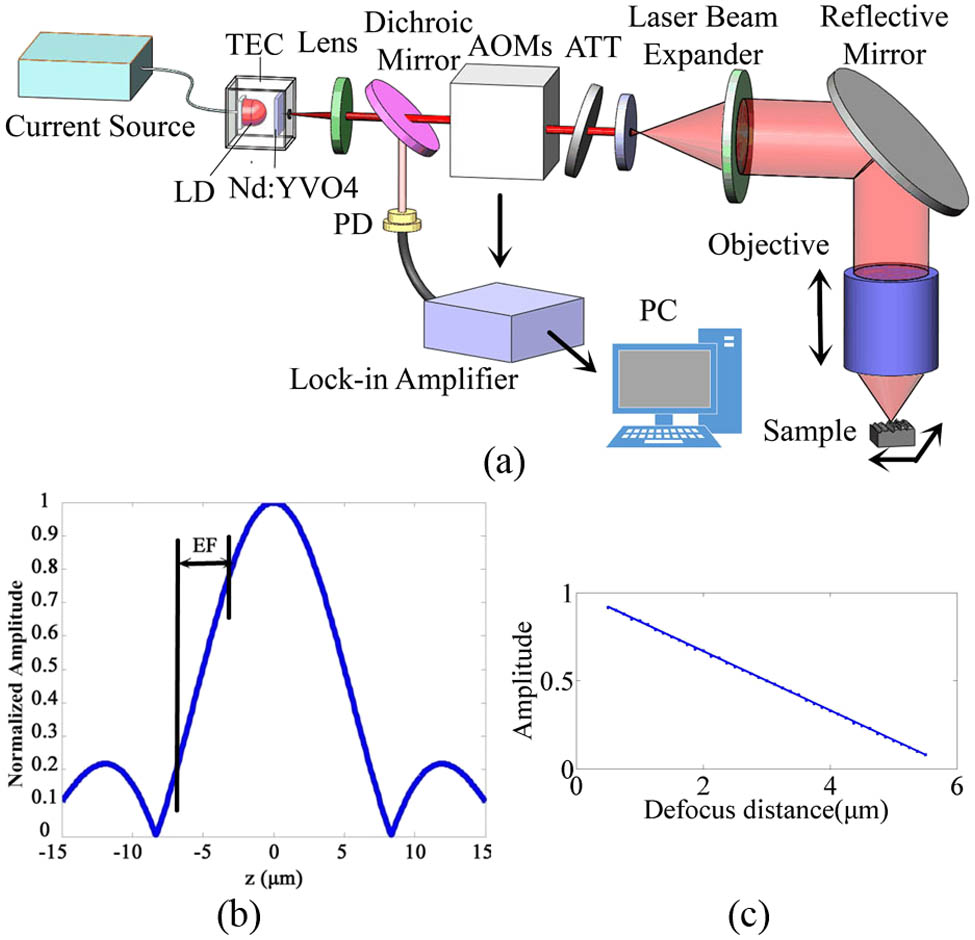
Fig. 1. Configuration and physical principles of the system. (a) The system schematic. (b) The normalized defocusing curve with a certain objective. (c) The calibrated linear range.
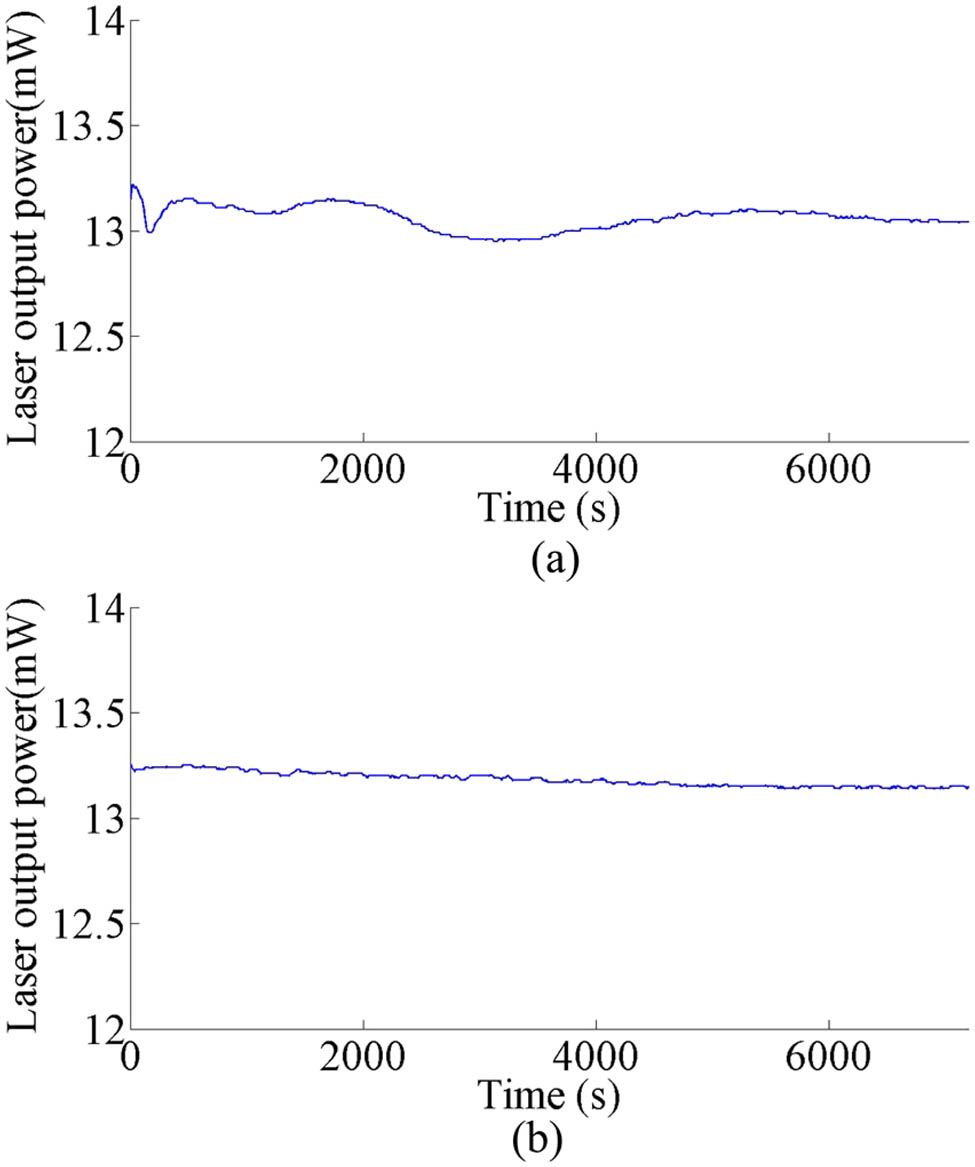
Fig. 2. Nd : YVO 4
Fig. 3. Normalized linear ranges with different objective lenses. (a) Linear range with the objective of NA = 0.65 NA = 0.55 NA = 0.3
Fig. 4. Measured results of the silicon grating profile. (a) Grating profile measured by AFM. (b) Grating profile measured by our system.
Fig. 5. Physical maps of the micro-gyroscope and the rotor. (a) The micro-gyroscope to be measured. (b) Upper: the rotor corroded from the micro-gyroscope; lower: the top view of the rotor.
Fig. 6. Cross section of the rotor along the scanning direction in Fig. 5(b) . The red circle shows the edge to be measured.
Fig. 7. Measurement results. Left: Lateral scanning diagram of the rotor; right: the edge slope of the rotor.
|
Table 1. Verticality of Micro-Gyro Rotor

Set citation alerts for the article
Please enter your email address
© Copyright 2018-2021 | Chinese Laser Press. All Rights Reserved 沪ICP备15018463号-20