• Chinese Journal of Lasers
  • Vol. 49, Issue 22, 2202001 (2022)
Xingwei Sun1、2, Zhong Zhang1、2, Heran Yang1、2、*, Zhixu Dong1、2, and Yin Liu1、2
Author Affiliations
  • 1School of Mechanical Engineering, Shenyang University of Technology, Shenyang 110870, Liaoning, China
  • 2Key Laboratory of Numerical Control Manufacturing Technology for Complex Surfaces of Liaoning Province, Shenyang 110870, Liaoning, China
  • show less
    DOI: 10.3788/CJL202249.2202001 Cite this Article Set citation alerts
    Xingwei Sun, Zhong Zhang, Heran Yang, Zhixu Dong, Yin Liu. Optimization of Laser Cleaning Process Parameters for Petroleum Pipe Threads Based on Response Surface Method and Particle Swarm Algorithm[J]. Chinese Journal of Lasers, 2022, 49(22): 2202001 Copy Citation Text show less
    Laser cleaning platform. (a) Principle diagram of laser cleaning; (b) experimental equipment for laser cleaning; (c) scanning electron microscope; (d) confocal laser microscope; (e) ultra-depth-of-field microscope; (f) laser cleaning test bench for pipe thread
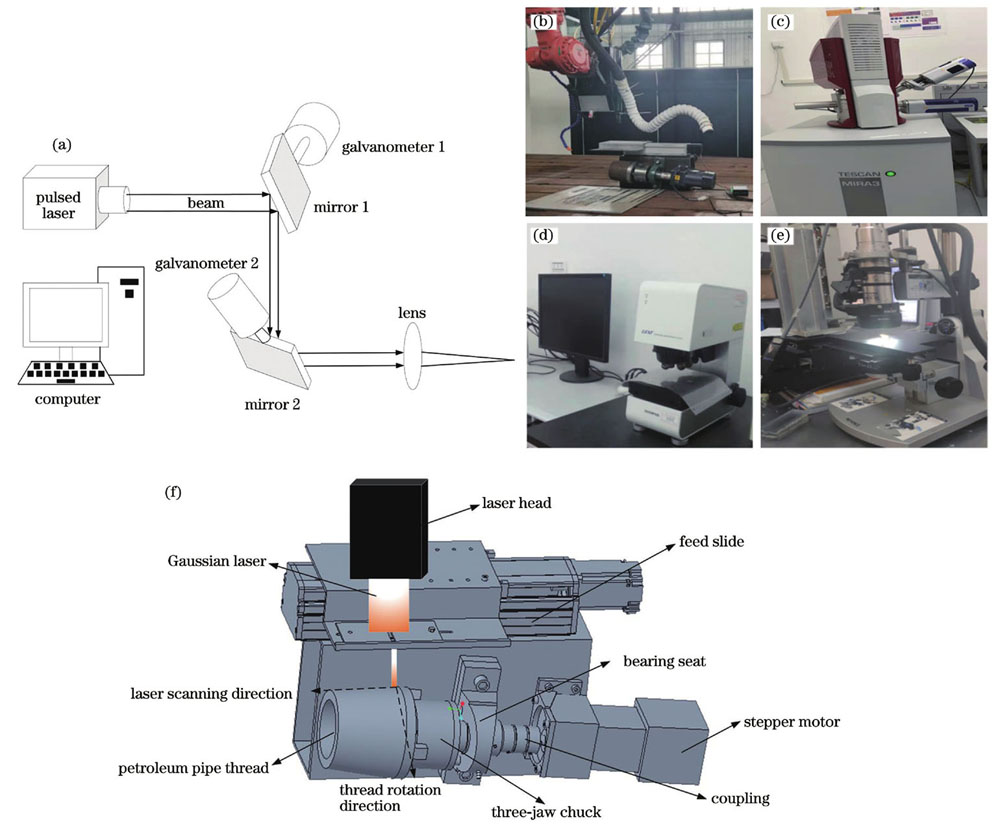
    Fig. 1. Laser cleaning platform. (a) Principle diagram of laser cleaning; (b) experimental equipment for laser cleaning; (c) scanning electron microscope; (d) confocal laser microscope; (e) ultra-depth-of-field microscope; (f) laser cleaning test bench for pipe thread
    Surface morphologies of rust layer. (a) Macro-morphology of petroleum pipe thread; (b) micro-morphology of peeling layer easy to fall off in rust layer; (c) micro-morphology of dense layer; (d) element content distribution of rust layer
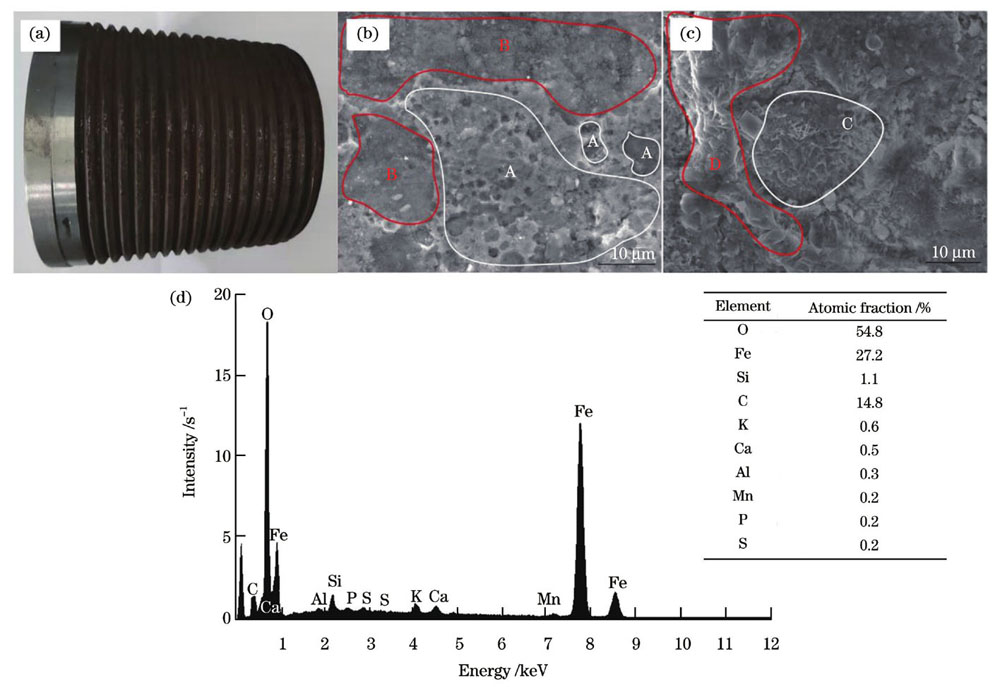
    Fig. 2. Surface morphologies of rust layer. (a) Macro-morphology of petroleum pipe thread; (b) micro-morphology of peeling layer easy to fall off in rust layer; (c) micro-morphology of dense layer; (d) element content distribution of rust layer
    Thread surface after laser cleaning. (a) Overall morphology; (b) local amplification at A′
    Fig. 3. Thread surface after laser cleaning. (a) Overall morphology; (b) local amplification at A′
    Sample after wire cutting
    Fig. 4. Sample after wire cutting
    Micro-morphologies under different laser powers. (a) 600 W; (b) 550 W; (c) 500 W; (d) 450 W; (e) 400 W
    Fig. 5. Micro-morphologies under different laser powers. (a) 600 W; (b) 550 W; (c) 500 W; (d) 450 W; (e) 400 W
    Surface roughnesses under different laser powers
    Fig. 6. Surface roughnesses under different laser powers
    Contents of oxygen elements under different laser powers
    Fig. 7. Contents of oxygen elements under different laser powers
    Micro-morphologies under different defocusing amounts. (a) +4 mm; (b) +3 mm; (c) +2 mm; (d) +1 mm; (e) 0 mm
    Fig. 8. Micro-morphologies under different defocusing amounts. (a) +4 mm; (b) +3 mm; (c) +2 mm; (d) +1 mm; (e) 0 mm
    Surface roughnesses under different defocusing amounts
    Fig. 9. Surface roughnesses under different defocusing amounts
    Contents of oxygen elements under different defocusing amounts
    Fig. 10. Contents of oxygen elements under different defocusing amounts
    Micro-morphologies under different scanning speeds. (a) 3000 mm/s; (b) 2500 mm/s; (c) 2000 mm/s; (d) 1500 mm/s; (e) 1000 mm/s
    Fig. 11. Micro-morphologies under different scanning speeds. (a) 3000 mm/s; (b) 2500 mm/s; (c) 2000 mm/s; (d) 1500 mm/s; (e) 1000 mm/s
    Surface roughnesses under different scanning speeds
    Fig. 12. Surface roughnesses under different scanning speeds
    Contents of oxygen elements under different scanning speeds
    Fig. 13. Contents of oxygen elements under different scanning speeds
    Residual plot of mathematical model
    Fig. 14. Residual plot of mathematical model
    Flow chart of improved particle swarm algorithm
    Fig. 15. Flow chart of improved particle swarm algorithm
    Convergence curves of two algorithms
    Fig. 16. Convergence curves of two algorithms
    Contents of elements after cleaning under optimized process parameters
    Fig. 17. Contents of elements after cleaning under optimized process parameters
    Molten pool morphology after cleaning under optimized process parameters
    Fig. 18. Molten pool morphology after cleaning under optimized process parameters
    ParameterValue
    Wavelength /nm1064
    Laser power /W≤1000
    Pulse width /ns100
    Frequency /kHz≤100
    Scanning speed /(mm·s-1)≤3000
    Spot diameter /mm0.05
    Table 1. Main parameters of pulsed lasers
    LevelLaser power /WScanning speed /(mm·s-1)Defocusing amount /mm
    Level 14003000+4
    Level 24502500+3
    Level 35002000+2
    Level 45501500+1
    Level 560010000
    Table 2. Orthogonal test level and parameters
    Experiment No.Laser power /WScanning speed /(mm·s-1)Defocusing amount /mmSurface roughness /μm
    16003000+49.13
    26002500+38.84
    36002000+28.23
    46001500+19.27
    56001000011.82
    65503000+38.21
    75502500+27.62
    85502000+18.13
    9550150008.44
    105501000+47.42
    115003000+26.53
    125002500+17.14
    13500200007.37
    145001500+48.83
    155001000+35.44
    164503000+18.25
    17450250007.67
    184502000+47.39
    194501500+36.64
    204501000+26.92
    214003000+17.81
    224002500+48.27
    234002000+37.23
    244001500+26.44
    254001000010.41
    Table 3. Experimental data
    LevelLaser powerScanning speedDefocusing amount
    Level 19.4587.9868.208
    Level 27.9647.9087.388
    Level 37.0627.6707.148
    Level 47.3747.9248.120
    Level 58.0328.4029.142
    Range2.3960.7321.994
    Table 4. Range analysis table
    Experiment No.Laser parameterSurface roughness /μm
    Laser power /WDefocusing amount /mmScanning speed /(mm·s-1)
    1500220005.77
    2450215006.26
    3500220006.36
    4450320005.14
    5500220005.82
    6500220005.44
    7450225005.61
    8500115006.14
    9550215006.38
    10500125007.14
    11500325005.25
    12550225007.62
    13500315004.85
    14450120006.75
    15550120008.13
    16500220005.74
    17550320006.65
    Table 5. Experimental design matrix
    SourceSum of squaresDegree of freedomMean squareF valueP valueReliability
    Model11.9091.3215.430.0008Significant
    A3.1513.1536.750.0005 
    B4.9114.9127.340.0001 
    C0.5010.505.780.0472 
    AB4.225×10-314.225×10-30.0490.8306 
    AC0.8910.8910.420.0145 
    BC0.0910.091.050.3396 
    A22.2612.2626.320.0014 
    B20.0510.050.590.4679 
    C20.03410.0340.400.5460 
    Residual0.6070.086   
    Lack of fit value0.1630.0520.470.7347Not significant
    Pure error0.4440.11   
    Total12.5016    
    RPRED2=0.7458RADJ2=0.8903   
    R=13.734   
    Table 6. Analysis of model variance
    Xingwei Sun, Zhong Zhang, Heran Yang, Zhixu Dong, Yin Liu. Optimization of Laser Cleaning Process Parameters for Petroleum Pipe Threads Based on Response Surface Method and Particle Swarm Algorithm[J]. Chinese Journal of Lasers, 2022, 49(22): 2202001
    Download Citation