
Teng Wang, Ao Yang, Fan Shi, Yiping Huang, Jianxiang Wen, Xianglong Zeng. High-order mode lasing in all-FMF laser cavities[J]. Photonics Research, 2019, 7(1): 42
- Photonics Research
- Vol. 7, Issue 1, 42 (2019)
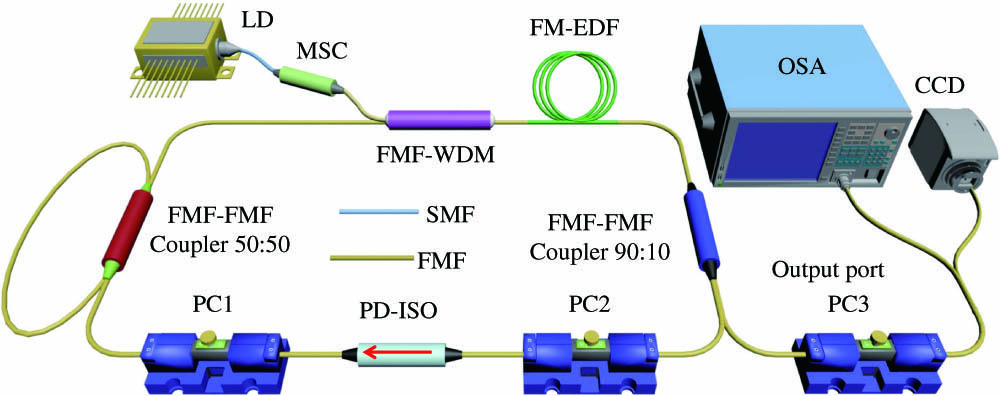
Fig. 1. Schematic of a multiwavelength all-FMF ring laser. LD, laser diode; MSC, mode-selective coupler; FMF-WDM, few-mode fiber wavelength division multiplexer; FM-EDF, few mode erbium-doped fiber; PD-ISO, polarization dependent isolator; PC, polarization controller; OSA, optical spectrum analyzer; CCD, charge-coupled device, infrared camera.
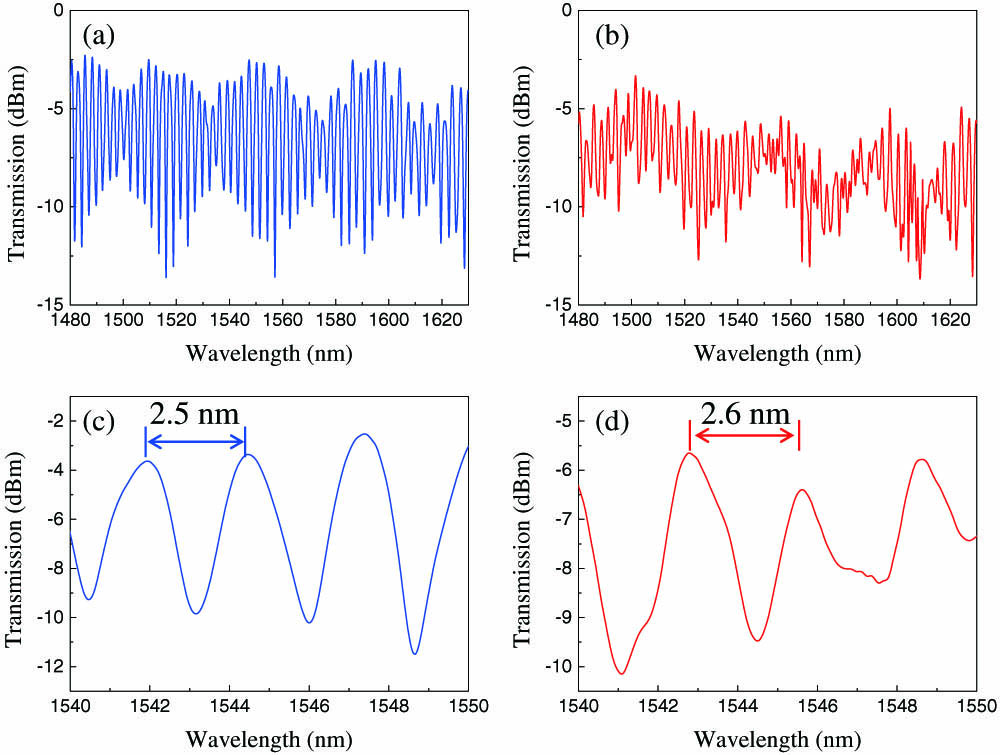
Fig. 2. Spectral response of an all-FMF Sagnac interferometer. Transmission spectra with different launch modes: (a) LP 01 LP 11
Fig. 3. Spectra of multiwavelength operations when adjusting the PCs. Output spectra of successively tunable (a) single-, (b) dual-, (c) triple-, and (d) quadruple-wavelength lasing operations.
Fig. 4. Stability of triple-wavelength output spectra. (a) Repeated scans of the triple-wavelength output spectrum every two minutes. (b) Power fluctuation (black) and central wavelength (blue) of each channel.
Fig. 5. Near-field intensity distributions of the FMF laser. (a) Single-wavelength LP 11 LP 11
Fig. 6. Schematic of Q
Fig. 7. (a) Output optical spectrum of a Q Q
Fig. 8. (a) Average output power and pulse energy versus pump power. (b) Pulse duration and repetition rate versus pump power.
Fig. 9. Near-field intensity distribution of TM 01 TE 01

Set citation alerts for the article
Please enter your email address
© Copyright 2018-2021 | Chinese Laser Press. All Rights Reserved 沪ICP备15018463号-20