• Opto-Electronic Science
  • Vol. 1, Issue 8, 220003 (2022)
Wenfeng Sun1、2, Xinke Wang1、2, and Yan Zhang1、2、*
Author Affiliations
  • 1Department of Physics, Capital Normal University, Beijing 100048, China
  • 2Beijing Key Lab of Metamaterials and Devices, and Key Laboratory of Terahertz Optoelectronics, Ministry of Education, Beijing 100048, China
  • show less
    DOI: 10.29026/oes.2022.220003 Cite this Article
    Wenfeng Sun, Xinke Wang, Yan Zhang. Terahertz generation from laser-induced plasma[J]. Opto-Electronic Science, 2022, 1(8): 220003 Copy Citation Text show less
    Schematic diagram of THz generation from laser-induced plasma in gas, liquid, and solid.
    Fig. 1. Schematic diagram of THz generation from laser-induced plasma in gas, liquid, and solid.
    Schematic diagram of THz generation by the ponderomotive force.Jr, Jz are the radial and axial currents, respectively. λp is plasma wavelength. τL is laser pulse duration. Figure reproduced with permission from ref.48, American Physical Society.
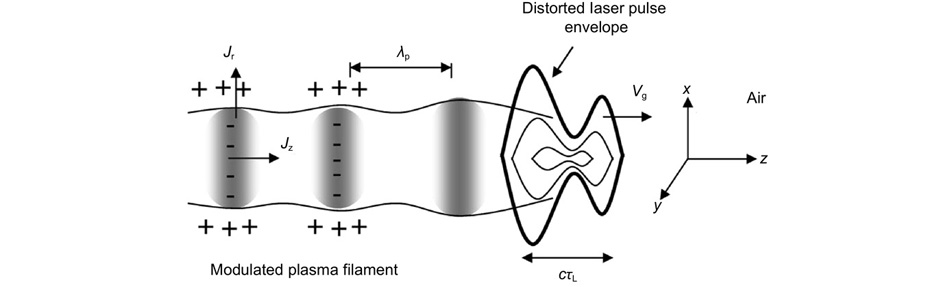
    Fig. 2. Schematic diagram of THz generation by the ponderomotive force.Jr, Jz are the radial and axial currents, respectively. λp is plasma wavelength. τL is laser pulse duration. Figure reproduced with permission from ref.48, American Physical Society.
    Schematic of experimental setup for measurement of THz waves from transition-Cherenkov emission. Figure reproduced with permission from ref.57, American Physical Society.
    Fig. 3. Schematic of experimental setup for measurement of THz waves from transition-Cherenkov emission. Figure reproduced with permission from ref.57, American Physical Society.
    Dependence of THz signal on the phase shift between the FW and SHW. The distance of BBO-to-focus corresponds the variety of the phase shift between the two-color pulses. Figure reproduced with permission from ref.60, The Optical Society.
    Fig. 4. Dependence of THz signal on the phase shift between the FW and SHW. The distance of BBO-to-focus corresponds the variety of the phase shift between the two-color pulses. Figure reproduced with permission from ref.60, The Optical Society.
    Dependence of THz field on the electric field strength of (a) FW and (b) SHW. Figure reproduced with permission from ref.61, American Physical Society.
    Fig. 5. Dependence of THz field on the electric field strength of (a) FW and (b) SHW. Figure reproduced with permission from ref.61, American Physical Society.
    (a) Schematic of experimental setup for THz generation based on external electric fields in single color plasma and (b) experimental results. Figure reproduced with permission from: (a) ref.70, American Physical Society; (b) ref.71, The Optical Society.
    Fig. 6. (a) Schematic of experimental setup for THz generation based on external electric fields in single color plasma and (b) experimental results. Figure reproduced with permission from: (a) ref.70, American Physical Society; (b) ref.71, The Optical Society.
    THz signals generated from air plasma induced by (a) one-color pulse and (b) two-color pulse. Simulation result is shown by the red line in (a). Figure reproduced with permission from: (a) ref.70, American Physical Society; (b) ref.110, under a Creative Commons Attribution licence.
    Fig. 7. THz signals generated from air plasma induced by (a) one-color pulse and (b) two-color pulse. Simulation result is shown by the red line in (a). Figure reproduced with permission from: (a) ref.70, American Physical Society; (b) ref.110, under a Creative Commons Attribution licence.
    (a) Schematic of the experimental setup and (b) results of actively modulated THz spectra. Figure reproduced with permission from ref.115, The Optical Society.
    Fig. 8. (a) Schematic of the experimental setup and (b) results of actively modulated THz spectra. Figure reproduced with permission from ref.115, The Optical Society.
    Polarization of THz forward emission measured atθ= 10°. The experimental and simulation THz signals are denoted with black and red dots. Figure reproduced with permission from: ref.57, American Physical Society.
    Fig. 9. Polarization of THz forward emission measured atθ= 10°. The experimental and simulation THz signals are denoted with black and red dots. Figure reproduced with permission from: ref.57, American Physical Society.
    Measured and simulated far-field THz radiation profiles. Experimental results (a–d) were obtained by raster scanning of a pyroelectric detector with a silicon filter. (a) and (b) are from a plasma with the length of 10 mm. (c) and (d) are from a plasma with the length of 40 mm. (a) (c) Teflon and (b) (d) germanium filters are used for low and high frequency transmission. (e) and (f) are simulated THz profiles for a plasma with the length of 40 mm. Figure reproduced with permission from ref.132, American Physical Society.
    Fig. 10. Measured and simulated far-field THz radiation profiles. Experimental results (ad) were obtained by raster scanning of a pyroelectric detector with a silicon filter. (a) and (b) are from a plasma with the length of 10 mm. (c) and (d) are from a plasma with the length of 40 mm. (a) (c) Teflon and (b) (d) germanium filters are used for low and high frequency transmission. (e) and (f) are simulated THz profiles for a plasma with the length of 40 mm. Figure reproduced with permission from ref.132, American Physical Society.
    Intensity image recorded by a THz camera.(a) Unfocused THz intensity profile and (b) focused intensity THz profile. Figure reproduced with permission from ref.134, under a Creative Commons Attribution (CC BY) licence.
    Fig. 11. Intensity image recorded by a THz camera.(a) Unfocused THz intensity profile and (b) focused intensity THz profile. Figure reproduced with permission from ref.134, under a Creative Commons Attribution (CC BY) licence.
    Schematic diagram of experimental setup for THz focal-plane imaging. Figure reproduced with permission from ref.137, under a Creative Commons Attribution 4.0 International License.
    Fig. 12. Schematic diagram of experimental setup for THz focal-plane imaging. Figure reproduced with permission from ref.137, under a Creative Commons Attribution 4.0 International License.
    Intensity distributions of THz waves generated from plasmas with different lengths.THz images in the (a) time domain and (b) frequency domain. Figure reproduced with permission from ref.137, under a Creative Commons Attribution 4.0 International License.
    Fig. 13. Intensity distributions of THz waves generated from plasmas with different lengths.THz images in the (a) time domain and (b) frequency domain. Figure reproduced with permission from ref.137, under a Creative Commons Attribution 4.0 International License.
    Ponderomotive force–induced dipole model for THz generation from liquid water. (a) Schematic diagram of the diploe model for THz generation from the plasma in the water film. (b) Its simulation result. α, θr are the incidence and refractive angle for the laser pulse, β and θt are the detective angle and exiting angle for THz pulse. F and B indicate the forward and back propagation THz signals, respectively. Figure reproduced with permission from ref.144, AIP Publishing.
    Fig. 14. Ponderomotive force–induced dipole model for THz generation from liquid water. (a) Schematic diagram of the diploe model for THz generation from the plasma in the water film. (b) Its simulation result. α, θr are the incidence and refractive angle for the laser pulse, β and θt are the detective angle and exiting angle for THz pulse. F and B indicate the forward and back propagation THz signals, respectively. Figure reproduced with permission from ref.144, AIP Publishing.
    Model of ultrashort pulses propagation equation and its simulation results. (a) Visualization of the model description, (b) simulation result of THz signal with different liquid thickness and pump pulse duration, and (c) comparison of experiment results with simulated results abstracted from (b). Figure reproduced with permission from ref.147, The Optical Society.
    Fig. 15. Model of ultrashort pulses propagation equation and its simulation results. (a) Visualization of the model description, (b) simulation result of THz signal with different liquid thickness and pump pulse duration, and (c) comparison of experiment results with simulated results abstracted from (b). Figure reproduced with permission from ref.147, The Optical Society.
    Schematic diagram of the particle dynamics in the unified theoretical model.ap and νd are the acceleration and drift velocity of electrons, respectively. They are related to the laser propagation direction and electron dynamics in the water medium. The electrons are accelerated forward and backward between the ascending and descending edges owing to the ponderomotive force. νd is perpendicular to the laser propagation direction. The combined effect of ap and νd results in THz generation in liquid water. Figure reproduced with permission from ref.150, AIP Publishing.
    Fig. 16. Schematic diagram of the particle dynamics in the unified theoretical model.ap and νd are the acceleration and drift velocity of electrons, respectively. They are related to the laser propagation direction and electron dynamics in the water medium. The electrons are accelerated forward and backward between the ascending and descending edges owing to the ponderomotive force. νd is perpendicular to the laser propagation direction. The combined effect of ap and νd results in THz generation in liquid water. Figure reproduced with permission from ref.150, AIP Publishing.
    THz intensity versus incidence angle α for different detection angle β, (a) β = 0° and (b) β = 55°. The blue dots and black squares denote the data measured by a Golay cell and EO sampling, while the red line denotes the simulation results. F and B represent the forward and back propagation signals. Figure reproduced with permission from ref.144, AIP Publishing.
    Fig. 17. THz intensity versus incidence angle α for different detection angle β, (a) β = 0° and (b) β = 55°. The blue dots and black squares denote the data measured by a Golay cell and EO sampling, while the red line denotes the simulation results. F and B represent the forward and back propagation signals. Figure reproduced with permission from ref.144, AIP Publishing.
    Spectra of THz waves generated from a 120 μm thick water film with one-color (black line) and two-color (red line) excitation schemes in the case of the pulse duration of (a) 50 fs and (b) 300 fs. Figure reproduced with permission from ref.155, 156, AIP Publishing.
    Fig. 18. Spectra of THz waves generated from a 120 μm thick water film with one-color (black line) and two-color (red line) excitation schemes in the case of the pulse duration of (a) 50 fs and (b) 300 fs. Figure reproduced with permission from ref.155, 156, AIP Publishing.
    Spectra of THz waves generated from α-pinene and water. Figure reproduced with permission from ref.153, under a Creative Commons Attribution 4.0 Unported License.
    Fig. 19. Spectra of THz waves generated from α-pinene and water. Figure reproduced with permission from ref.153, under a Creative Commons Attribution 4.0 Unported License.
    (a) Dispersion curves of plasma waves and electromagnetic waves and (b) Cerenkov wake radiation. vb is the velocity of the disturbance that creates the wake in the medium. Figure reproduced with permission from: (a) ref.163, IEEE; (b) ref.164, American Physical Society.
    Fig. 20. (a) Dispersion curves of plasma waves and electromagnetic waves and (b) Cerenkov wake radiation. vb is the velocity of the disturbance that creates the wake in the medium. Figure reproduced with permission from: (a) ref.163, IEEE; (b) ref.164, American Physical Society.
    Electron current distributions at the surface of solid target obtained from 2D particle-in-cell simulations. (a), (b), and (c) are the cases at the time of 50, 60, and 70 laser cycles, respectively. Figure reproduced with permission from ref.169, AIP Publishing.
    Fig. 21. Electron current distributions at the surface of solid target obtained from 2D particle-in-cell simulations. (a), (b), and (c) are the cases at the time of 50, 60, and 70 laser cycles, respectively. Figure reproduced with permission from ref.169, AIP Publishing.
    Relation of the 3/2ω0 signal intensity of the scattered light with the THz energy. Figure reproduced with permission from ref.172, AIP Publishing.
    Fig. 22. Relation of the 3/2ω0 signal intensity of the scattered light with the THz energy. Figure reproduced with permission from ref.172, AIP Publishing.
    Schematic diagrams of two main mechanisms for THz generation from plasma emission.(a) Coherent transition radiation and (b) sheath radiation. Figure reproduced with permission from ref.175, under a Creative Commons Attribution (CC BY) licence.
    Fig. 23. Schematic diagrams of two main mechanisms for THz generation from plasma emission.(a) Coherent transition radiation and (b) sheath radiation. Figure reproduced with permission from ref.175, under a Creative Commons Attribution (CC BY) licence.
    GasLiquidSolid
    ConfigurationAtmosphereFilm, line, dropletFoil, bulk
    Laser excitation intensityNonrelativisticNonrelativisticRelativistic, >10 18 W/cm2
    Excitation fieldOne/two-colorOne/two-colorOne-color
    THz field>100 MV/cm96~MV/cm149~0.8 GV/cm183
    Conversion efficiency2.36%96>0.1%149~0.1%183
    THz energy0.185 mJ9676 μJ 149~2.3 mJ183
    THz bandwidth>50 THz96~100 THz149<20 THz183
    GeometryEasyComplicatedComplicated
    Laser pulse width~fs~psfs-ps
    Detective THz yieldForward/sidewayForward/sidewayForward/sideway/backward
    Table 1. Comparison of THz generation from laser-induced plasma in gas, liquid, and solid.
    Wenfeng Sun, Xinke Wang, Yan Zhang. Terahertz generation from laser-induced plasma[J]. Opto-Electronic Science, 2022, 1(8): 220003
    Download Citation