
Longhui Lu, Deming Liu, Max Yan, Minming Zhang. On-chip reconfigurable mode converter based on cross-connected subwavelength Y-junctions[J]. Photonics Research, 2021, 9(1): 43
- Photonics Research
- Vol. 9, Issue 1, 43 (2021)
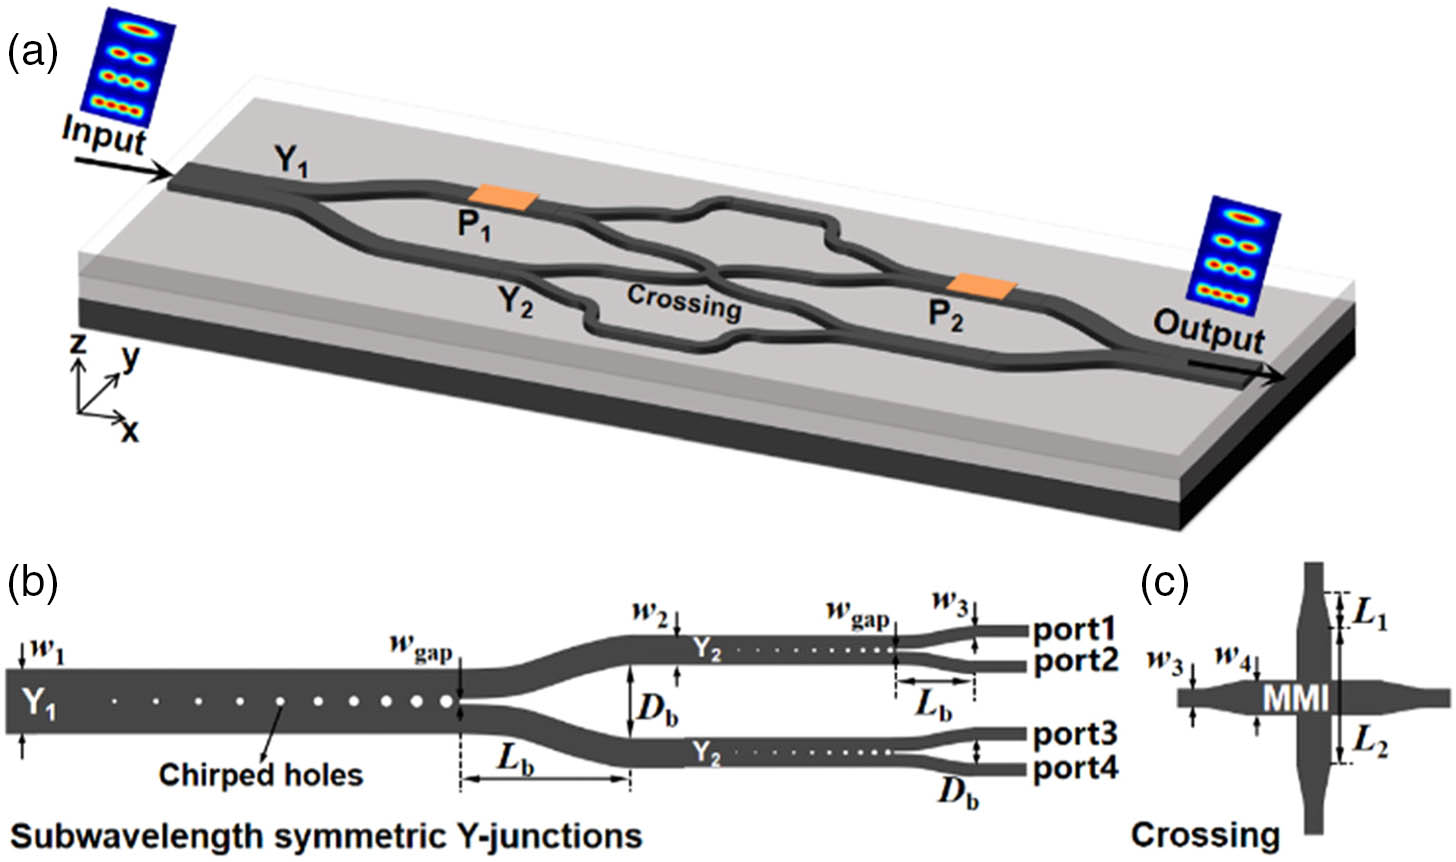
Fig. 1. Schematic diagrams showing (a) the structure of the proposed mode converter consisting of cross-connected symmetric Y-junctions, (b) subwavelength four- and dual-mode symmetric Y-junctions, and (c) single-mode waveguide crossing.
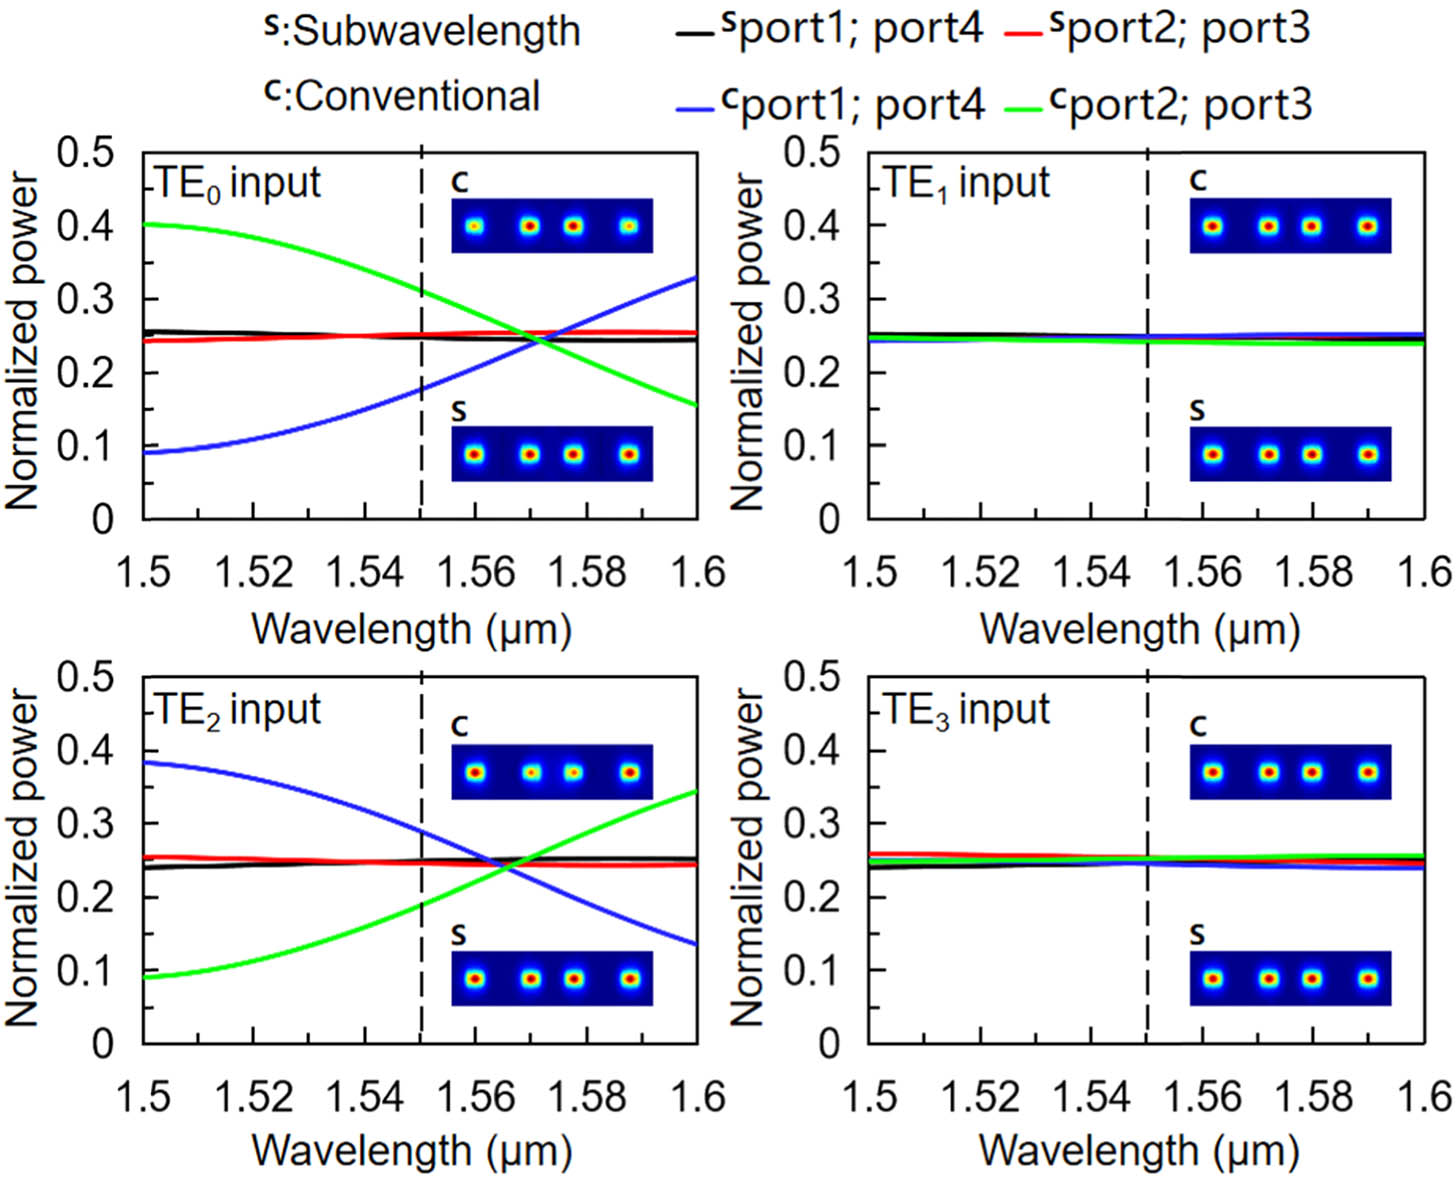
Fig. 2. Simulated normalized transmission spectra of the 1 × 4 TE 0 TE 1 TE 2 TE 3
Fig. 3. Simulated distributions of the H z 1 × 4 TE 0 TE 1 TE 2 TE 3
Fig. 4. Simulated spectra of the cross-connected converter with no voltages applied to the electrode heaters for four different input modes. The dotted lines represent the simulated results with different fabrication errors.
Fig. 5. (a) Optical microscopic image of the reference MDM system. The optical microscopic image of the reconfigurable four-mode MDM systems consisted of (b) cross- and (c) parallel-connected converters; (d) the reference system to determine the power to produce a π
Fig. 6. (a) States of the phase shifters and the power consumption in a specific conversion function. (b) The normalized IL and XT profiles of the converter measured with the TE 0 P 1 P 2
Fig. 7. Measured average ILs, average XTs, and power consumptions for all different conversion functions of cross- and parallel-connected converters, respectively. The inset is the average power consumptions of the 16 conversion functions for cross- and parallel-connected converters.
Table 1. Mode Conversion Functions of the Thermo-Optic Cross-Connected Symmetric Y-Junctions

Set citation alerts for the article
Please enter your email address
© Copyright 2018-2021 | Chinese Laser Press. All Rights Reserved 沪ICP备15018463号-20