• Acta Photonica Sinica
  • Vol. 50, Issue 3, 148 (2021)
Chunhui ZHAO, Tong LI, and Shou FENG*
Author Affiliations
  • School of Information and Communication Engineering, Harbin Engineering University, Harbin150001, China
  • show less
    DOI: 10.3788/gzxb20215003.0310001 Cite this Article
    Chunhui ZHAO, Tong LI, Shou FENG. Hyperspectral Image Classification Based on Dense Convolution and Domain Adaptation[J]. Acta Photonica Sinica, 2021, 50(3): 148 Copy Citation Text show less
    Example of a DenseNet with four layers (i = 4)
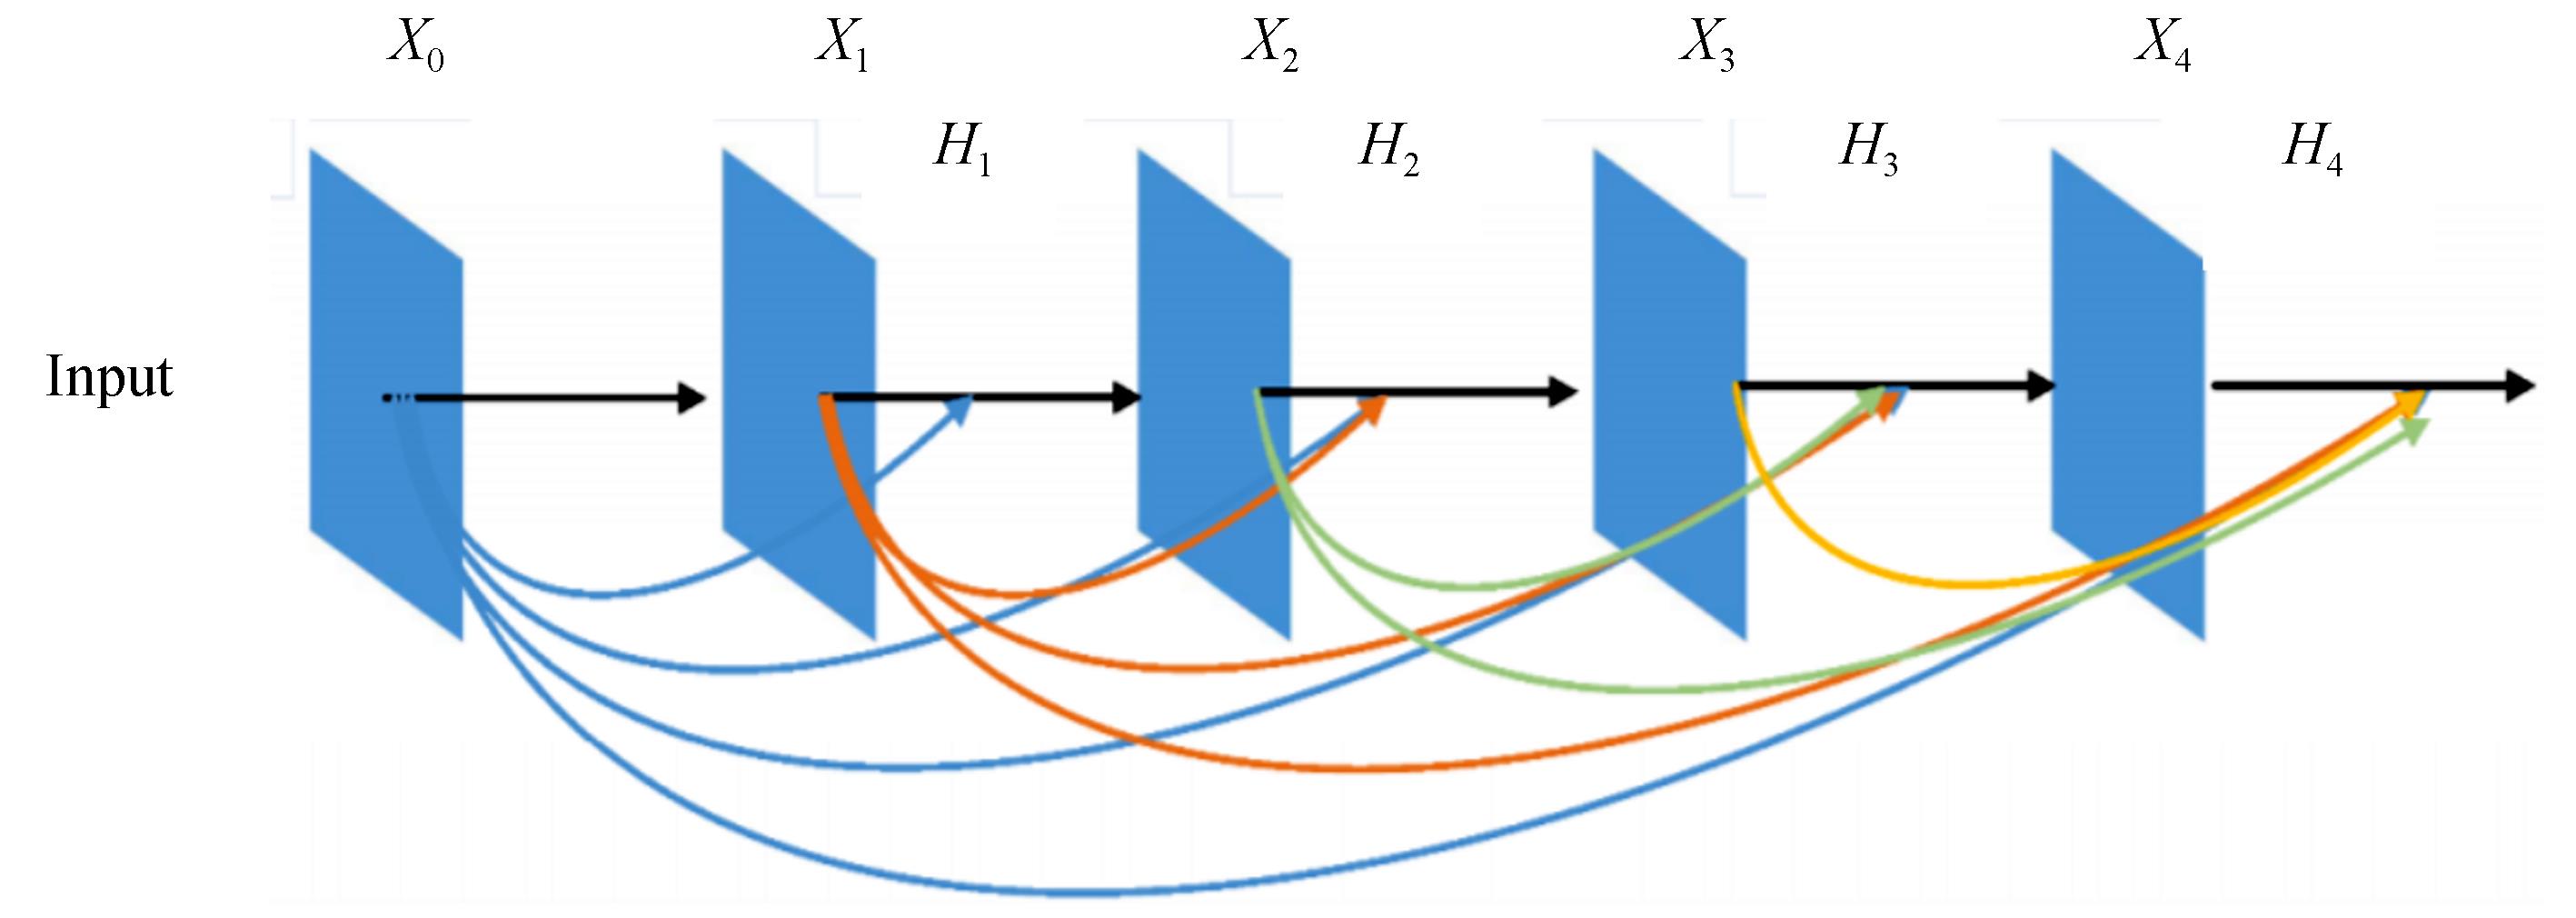
    Fig. 1. Example of a DenseNet with four layers (i = 4)
    Subspace feature transformation
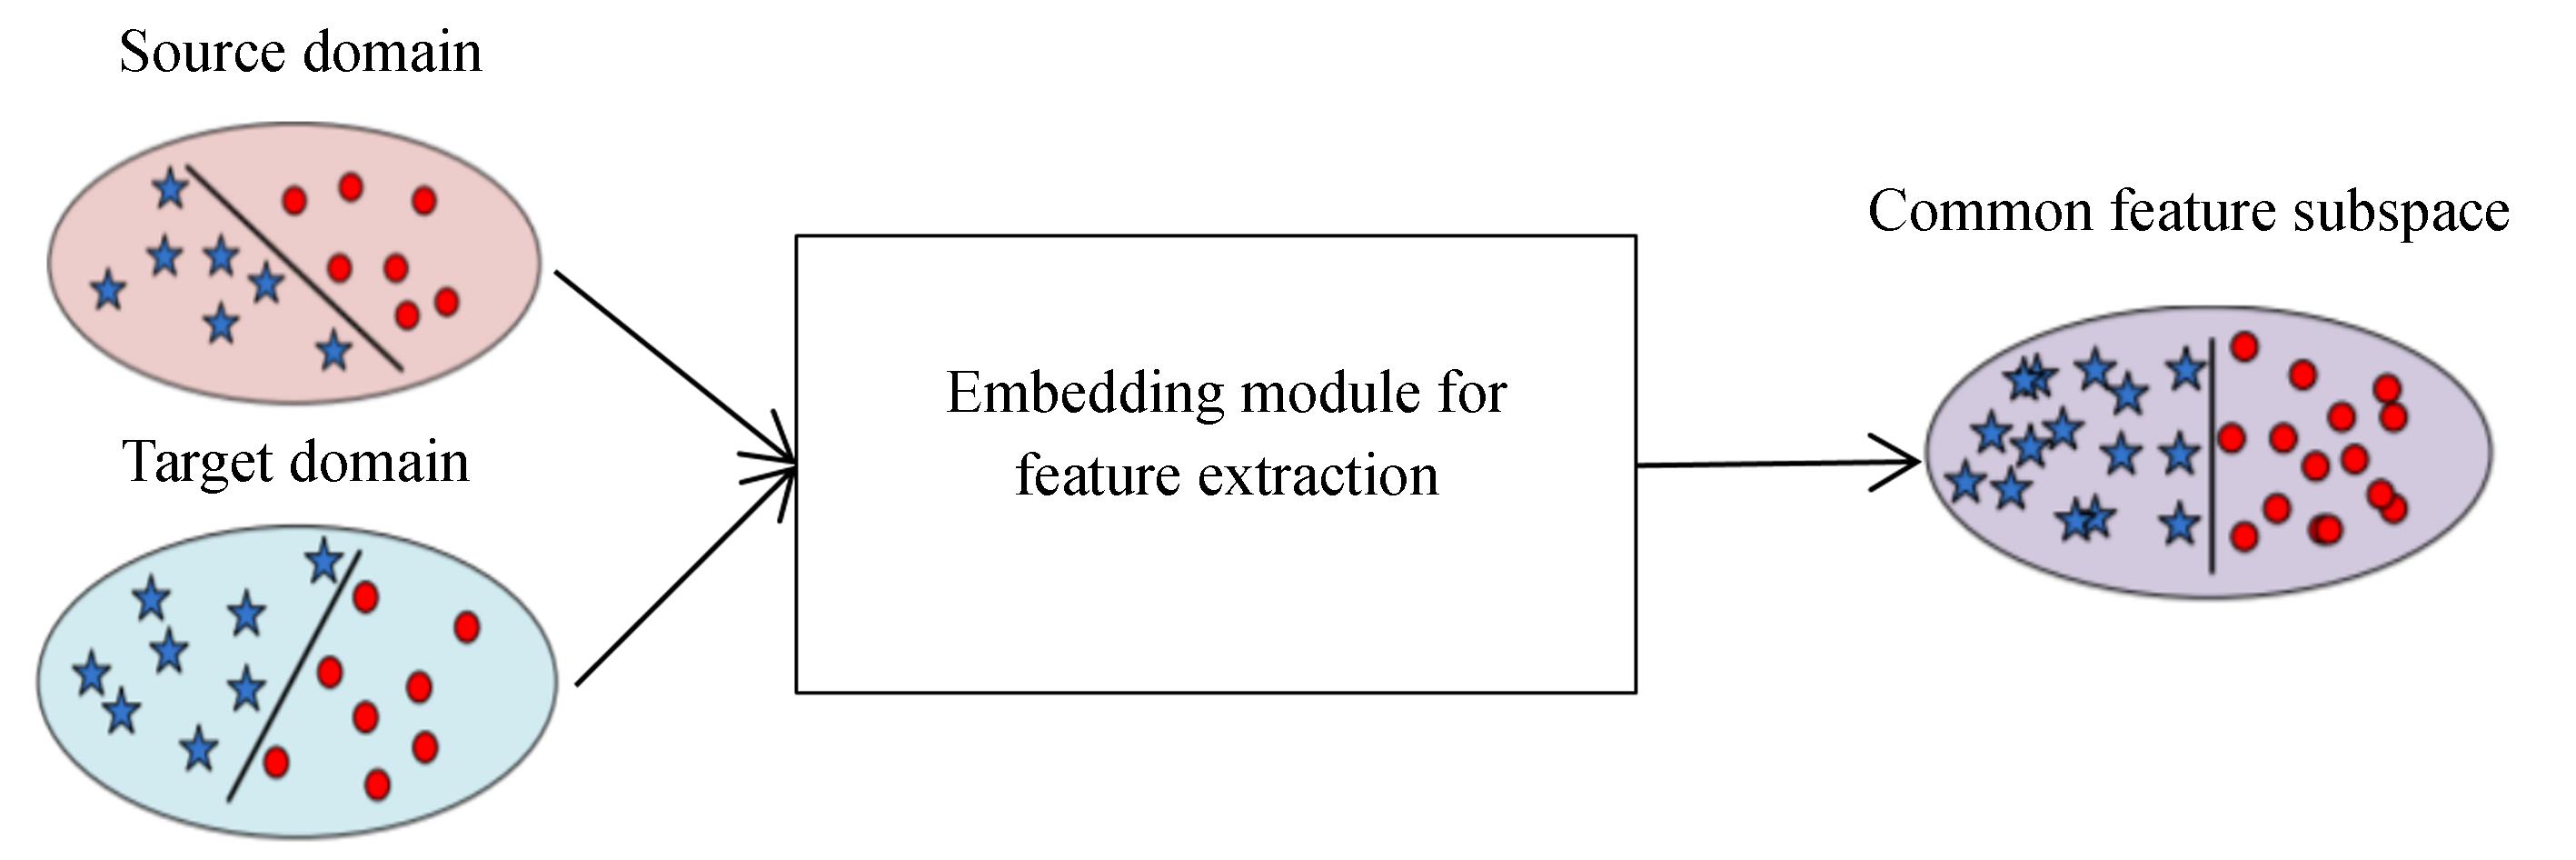
    Fig. 2. Subspace feature transformation
    Schematic of the hyperspectral image classification based on DCDA
    Fig. 3. Schematic of the hyperspectral image classification based on DCDA
    Schematic of the dense convolution-based embedding module (The number of convolutional layers is 3)
    Fig. 4. Schematic of the dense convolution-based embedding module (The number of convolutional layers is 3)
    Schematic of the discriminator module
    Fig. 5. Schematic of the discriminator module
    Source and target images in Indiana dataset
    Fig. 6. Source and target images in Indiana dataset
    Source and target images in Pavia dataset
    Fig. 7. Source and target images in Pavia dataset
    Source and target image spectral curves
    Fig. 8. Source and target image spectral curves
    Classification result of target Indiana dataset
    Fig. 9. Classification result of target Indiana dataset
    Classification result of target Indiana dataset
    Fig. 10. Classification result of target Indiana dataset
    ClassNameTraining samplesTesting samplesClassification accuracy/%
    1Concrete/Asphalt1802 94253.18
    2Corn-CleanTill1806 02925.01
    3Corn-CleanTill-EW1807 99941.15
    4Orchard1801 56293.90
    5Soybeans-CleanTill1804 79242.29
    6Soybeans-CleanTil-EW1801 63880.72
    7Wheat18010 73982.16
    Total1 26035 701OA=61.60%
    Table 1. Number of samples in the Indiana dataset and classification accuracy of each category

    Algorithm name

    OA/%

    AA/%

    κ

    TSVM

    39.19

    33.82

    0.27

    SD-MTJDL-SLR

    51.34

    43.51

    0.38

    ED-DMM-UDA

    56.78

    51.68

    0.46

    DCDA

    61.60

    61.79

    0.53

    Table 2. Comparison of classification accuracy in the Indiana dataset
    ClassNameTraining samplesTesting samplesClassification accuracy/%
    1Trees1802 42492.14
    2Asphalt1801 70494.36
    3Paking lot180287100
    4Bitumen18068581.35
    5Meadow1801 25195.78
    6Soil1801 47581.99
    Total1 0807 826OA=90.63%
    Table 3. Number of samples in the Pavia dataset and classification accuracy of each category

    Algorithm name

    OA/%

    AA/%

    κ

    TSVM

    61.21

    61.50

    0.53

    SD-MTJDL-SLR

    83.52

    81.30

    0.79

    ED-DMM-UDA

    90.34

    87.87

    0.88

    DCDA

    90.63

    90.08

    0.88

    Table 4. Comparison of classification accuracy in the Pavia dataset
    Chunhui ZHAO, Tong LI, Shou FENG. Hyperspectral Image Classification Based on Dense Convolution and Domain Adaptation[J]. Acta Photonica Sinica, 2021, 50(3): 148
    Download Citation