• Chinese Optics Letters
  • Vol. 13, Issue 11, 111701 (2015)
Hongjiang Chen1, Zhongjiang Chen2, Jankun Xu1, and Jun Hu1、2、*
Author Affiliations
  • 1Department of Orthopaedics, the First Affiliated Hospital, Shantou University Medical College, Shantou 515041, China
  • 2MOE Key Laboratory of Laser Life Science & Institute of Laser Life Science, College of Biophotonics, South China Normal University, Guangzhou 510631, China
  • show less
    DOI: 10.3788/COL201513.111701 Cite this Article Set citation alerts
    Hongjiang Chen, Zhongjiang Chen, Jankun Xu, Jun Hu. Imaging of nerve injury with HSP27 antibody-functionalized photoacoustic nanoprobes[J]. Chinese Optics Letters, 2015, 13(11): 111701 Copy Citation Text show less
    Scheme of the photoacoustic microscopy system.
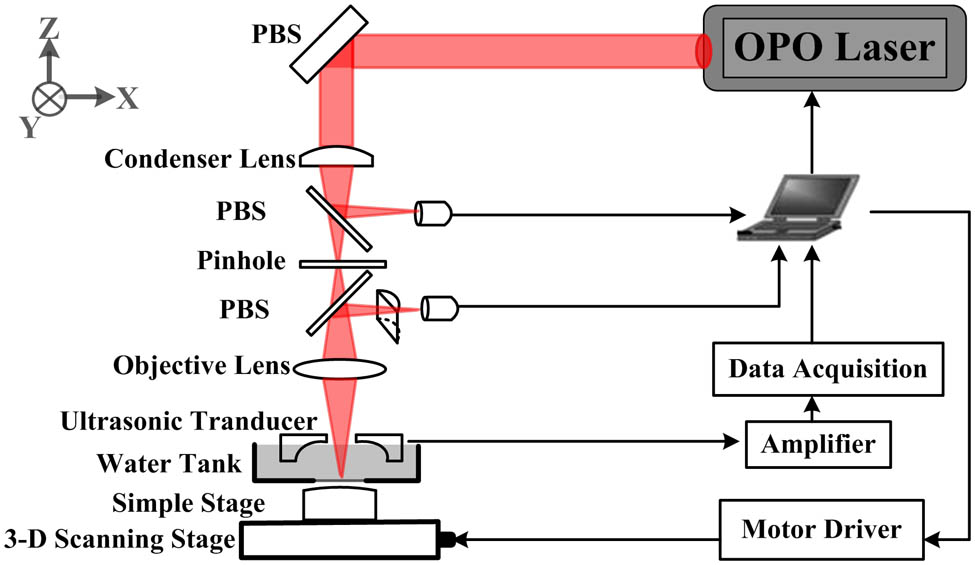
    Fig. 1. Scheme of the photoacoustic microscopy system.
    Effect of trauma on the protein expression level of HSP27. (a) Western blot of HSP27 protein in the total lysate collected from the sciatic nerve of naive rats (control) and at 3 and 7 days after trauma (3d, 7d). The treatment induced a time-dependent increase in HSP27 protein levels. Note that the anti-HSP27 antibody recognized a band of 27 kDa in size. The expression of β-actin (43 kDa) was shown as a control for equal protein loading. (b) One-way ANOVA was used to compare differences between control and treated groups. Values of HSP27 protein levels were normalized to β-actin and the data were graphed as mean±S.E.M. **, p<0.01 and ***, p<0.001.
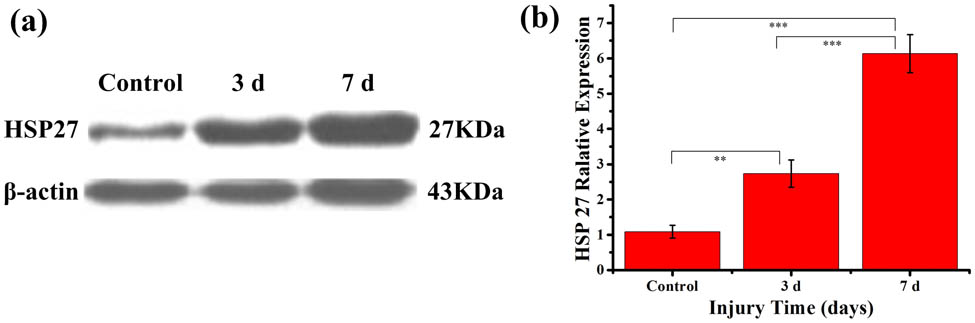
    Fig. 2. Effect of trauma on the protein expression level of HSP27. (a) Western blot of HSP27 protein in the total lysate collected from the sciatic nerve of naive rats (control) and at 3 and 7 days after trauma (3d, 7d). The treatment induced a time-dependent increase in HSP27 protein levels. Note that the anti-HSP27 antibody recognized a band of 27 kDa in size. The expression of β-actin (43 kDa) was shown as a control for equal protein loading. (b) One-way ANOVA was used to compare differences between control and treated groups. Values of HSP27 protein levels were normalized to β-actin and the data were graphed as mean±S.E.M. **, p<0.01 and ***, p<0.001.
    Illustration of the nanotargeted probe. (a) The schematic diagram of Au NPs-HSP27Abs and the graphical symbols represent the components of Au NPs-HSP27Abs. (b) The insert is a TEM image of Au NPs with a scale bar of 20 nm.
    Fig. 3. Illustration of the nanotargeted probe. (a) The schematic diagram of Au NPs-HSP27Abs and the graphical symbols represent the components of Au NPs-HSP27Abs. (b) The insert is a TEM image of Au NPs with a scale bar of 20 nm.
    (a) Absorbance spectra of Au NPs-HSP27Abs (red curve) and Au NPs (black curve) in PBS. (b) Fluorescence emission spectra of Au NPs-HSP27Abs (red curve) and Au NPs (black curve) in PBS with an excitation wavelength of 488 nm. (c) Photoacoustic signals of Au NPs-HSP27Abs at various Au NPs concentrations. (d) Linear fitting of photoacoustic signal intensity under the corresponding Au NPs concentrations.
    Fig. 4. (a) Absorbance spectra of Au NPs-HSP27Abs (red curve) and Au NPs (black curve) in PBS. (b) Fluorescence emission spectra of Au NPs-HSP27Abs (red curve) and Au NPs (black curve) in PBS with an excitation wavelength of 488 nm. (c) Photoacoustic signals of Au NPs-HSP27Abs at various Au NPs concentrations. (d) Linear fitting of photoacoustic signal intensity under the corresponding Au NPs concentrations.
    Photoacoustic microscopy images of unlabeled and Au NPs-HSP27Abs-labeled neurons in vitro. (a) Photoacoustic microscopy image of neurons incubated with Au NPs. (b) Photoacoustic microscopy image of neurons labeled with Au NPs-HSP27Abs.
    Fig. 5. Photoacoustic microscopy images of unlabeled and Au NPs-HSP27Abs-labeled neurons in vitro. (a) Photoacoustic microscopy image of neurons incubated with Au NPs. (b) Photoacoustic microscopy image of neurons labeled with Au NPs-HSP27Abs.
    Photoacoustic microscopy of normal and injured sciatic nerve using Au NPs and Au NPs-HSP27Abs as contrast agents. (a) Samples were arranged in parallel embedded in an agar phantom (D). Photoacoustic imaging of samples, including an injured nerve incubated with Au NPs (A), an injured nerve incubated with Au NPs-HSP27Abs (B), and a normal nerve incubated with Au NPs-HSP27Abs (C). (b) Photoacoustic microscopy signal intensity profiles extracted from the image along the horizontal white line running through the three nerve samples. The images of (a) were obtained by ultrasonic transducer array scanning with an excitation wavelength of 532 nm. The photoacoustic signal intensities of (b) correspond to the locations of the nerve being marked with a white line going through the three nerve sample in (a).
    Fig. 6. Photoacoustic microscopy of normal and injured sciatic nerve using Au NPs and Au NPs-HSP27Abs as contrast agents. (a) Samples were arranged in parallel embedded in an agar phantom (D). Photoacoustic imaging of samples, including an injured nerve incubated with Au NPs (A), an injured nerve incubated with Au NPs-HSP27Abs (B), and a normal nerve incubated with Au NPs-HSP27Abs (C). (b) Photoacoustic microscopy signal intensity profiles extracted from the image along the horizontal white line running through the three nerve samples. The images of (a) were obtained by ultrasonic transducer array scanning with an excitation wavelength of 532 nm. The photoacoustic signal intensities of (b) correspond to the locations of the nerve being marked with a white line going through the three nerve sample in (a).
    In vivo photoacoustic microscopy of an Au NP-HSP27Ab-targeted injured nerve. Nontargeting Au NPs or targeting Au NP-HSP27Abs (100 μL, 8 mmol/L) were injected to a normal or injured nerve in situ before imaging. (a) Image of a normal nerve following Au NP-HSP27Ab injection. (b) Image of an injured nerve 7 days after injury and injected with Au NPs. (c) Image of injured nerve 7 days after injury and injected with Au NPs-HSP27Ab.
    Fig. 7. In vivo photoacoustic microscopy of an Au NP-HSP27Ab-targeted injured nerve. Nontargeting Au NPs or targeting Au NP-HSP27Abs (100 μL, 8 mmol/L) were injected to a normal or injured nerve in situ before imaging. (a) Image of a normal nerve following Au NP-HSP27Ab injection. (b) Image of an injured nerve 7 days after injury and injected with Au NPs. (c) Image of injured nerve 7 days after injury and injected with Au NPs-HSP27Ab.
    (a) Viability of HL-7702 cells exposed to different concentrations of GNRs or GNRs-HSP27Abs. The data are plotted as the percentage of viable cells compared to untreated controls. (b) The serum levels of biochemical variables in rats at 3 and 7 days. Values are means +/− SD (ratio to control), n=3. There were no significant differences in any of the above parameters between the GNRs-HSP27Abs group and saline controls (p>0.05). BUN, blood urea nitrogen; AST, aspartate aminotransferase; ALT, serum alanine aminotransferase; LDH, lactate dehydrogenase.
    Fig. 8. (a) Viability of HL-7702 cells exposed to different concentrations of GNRs or GNRs-HSP27Abs. The data are plotted as the percentage of viable cells compared to untreated controls. (b) The serum levels of biochemical variables in rats at 3 and 7 days. Values are means +/ SD (ratio to control), n=3. There were no significant differences in any of the above parameters between the GNRs-HSP27Abs group and saline controls (p>0.05). BUN, blood urea nitrogen; AST, aspartate aminotransferase; ALT, serum alanine aminotransferase; LDH, lactate dehydrogenase.
    Hongjiang Chen, Zhongjiang Chen, Jankun Xu, Jun Hu. Imaging of nerve injury with HSP27 antibody-functionalized photoacoustic nanoprobes[J]. Chinese Optics Letters, 2015, 13(11): 111701
    Download Citation