1Technical Chemistry I and Center of Nanointegration Duisburg-Essen (CENIDE), University of Duisburg-Essen, Universitaetsstr. 7, 45141 Essen, Germany
2Department of Applied Sciences and Mechatronics, Munich University of Applied Sciences, Lothstr. 34, 80335 Munich, Germany
3Materials Science and Additive Manufacturing, School of Mechanical Engineering and Safety Engineering, University of Wuppertal, Gaußstraße 20, 42119 Wuppertal, Germany
Sarah Dittrich, Maximilian Spellauge, Stephan Barcikowski, Heinz P. Huber, Bilal Gökce. Time resolved studies reveal the origin of the unparalleled high efficiency of one nanosecond laser ablation in liquids[J]. Opto-Electronic Advances, 2022, 5(6): 210053
Copy Citation Text
Laser ablation in liquid is a scalable nanoparticle production method with applications in areas like catalysis and biomedicine. Due to laser-liquid interactions, different energy dissipation channels such as absorption by the liquid and scattering at the ablation plume and cavitation bubble lead to reduced laser energy available for nanoparticle production. Ultrashort pulse durations cause unwanted nonlinear effects in the liquid, and for ns pulses, intra-pulse energy deposition attenuation effects are to be expected. However, intermediate pulse durations ranging from hundreds of picoseconds up to one nanosecond have rarely been studied in particular in single-pulse settings. In this study, we explore the pico- to nanosecond pulse duration regimes to find the pulse duration with the highest ablation efficiency. We find that pulse durations around 1–2 ns enable the most efficient laser ablation in liquid since the laser beam shielding by the ablation plume and cavitation bubble sets in only at longer pulse durations. Furthermore, pump-probe microscopy imaging reveals that the plume dynamics in liquids start to differ from plume dynamics in air at about 2 ns after pulse impact.Laser ablation in liquid is a scalable nanoparticle production method with applications in areas like catalysis and biomedicine. Due to laser-liquid interactions, different energy dissipation channels such as absorption by the liquid and scattering at the ablation plume and cavitation bubble lead to reduced laser energy available for nanoparticle production. Ultrashort pulse durations cause unwanted nonlinear effects in the liquid, and for ns pulses, intra-pulse energy deposition attenuation effects are to be expected. However, intermediate pulse durations ranging from hundreds of picoseconds up to one nanosecond have rarely been studied in particular in single-pulse settings. In this study, we explore the pico- to nanosecond pulse duration regimes to find the pulse duration with the highest ablation efficiency. We find that pulse durations around 1–2 ns enable the most efficient laser ablation in liquid since the laser beam shielding by the ablation plume and cavitation bubble sets in only at longer pulse durations. Furthermore, pump-probe microscopy imaging reveals that the plume dynamics in liquids start to differ from plume dynamics in air at about 2 ns after pulse impact.
Introduction
Laser ablation in liquid (LAL) is a versatile method for the synthesis of nanoparticles (NPs), that enables the production of ligand-free colloids1-4. Compared to chemically synthesized colloids, particles generated by LAL exhibit a higher signal-to-noise ratio for laser desorption ionization mass spectrometry5, are suitable as reference materials for nano-toxicological assays6, enable the decoration of microparticles for 3D printing7, 8, and have high potential in heterogeneous catalysis9 even in industrial settings of automotive exhaust gas catalyst testing10. Furthermore, with LAL it is possible to produce molar fraction series of alloy NPs from pressed micropowder targets, even if an element miscibility gap exists11.
Although laser-generated particles show advantages over chemically synthesized NPs, only a few commercial distributors offer laser-generated NPs. A possible reason for this might be that LAL only becomes economically more feasible than chemical synthesis for nanoparticle productivities exceeding 550 mg/h (for gold)12. These high LAL productivities can be achieved only with high-power picosecond laser systems (>200 W)12, recently demonstrated to reach productivities of 8 g/h13. Therefore, high-power lasers are essential for ensuring an economically feasible process, when producing NPs from valuable material, such as noble metals. However, these high-power laser systems are operating at high repetition rates of several MHz and fast polygon scanners are required to effectively leverage the available laser power. The process complexity along with the high investment costs explains why only a few commercial distributors offer LAL generated NPs.
Besides scaling up the productivity by increasing the laser power, careful tuning of the laser pulse duration represents another route to optimize the LAL process. Nanosecond LAL (ns-LAL) has been shown to achieve similar power-specific ablation rates as picosecond LAL (ps-LAL)14. However, in the ns-LAL literature, mostly ~ 10 ns lasers are employed while only a few publications, for instance15, 16, investigated the lower pulse duration limit (~ 0.6 ns) that cavity-length limited, Q-switched lasers deliver.
In contrast to ablation in air, additional mechanisms of energy loss occur during LAL. These mechanisms can be divided into two categories that include (1) losses due to the interaction of the laser pulse with the water layer and (2) losses due to interaction of the laser pulse with the induced ablation dynamics. The extent of these loss mechanisms influence on LAL productivity strongly depends on the laser pulse duration.
Interaction of the laser pulse with the water layer includes linear reflection and absorption, optical breakdown, non-linear absorption, and shielding by NPs immersed in the liquid medium17.
Owing to the inherent design of LAL experiments, reflectance at the entrance window along with linear absorption of the laser energy by the liquid layer are inevitable. These losses result in the dissipation of up to half of the laser energy, regardless of the laser pulse duration15.
Optical breakdown within the liquid occurs when a plasma with a certain critical electron density is generated by the laser pulse through multiphoton ionization followed by cascade ionization18. In the case of ultrashort and nanosecond pulses the corresponding critical electron densities are approximately 1021 cm–3 and 1020 cm–3, respectively19. For optical breakdown in water at a wavelength of 1064 nm, the critical electron densities translate into threshold fluences of 1–13.5 J/cm² for <1 ps pulses and 100 – 300 J/cm² for >1 ns pulses 19. Vogel et al. measured the transmission through the breakdown volume for different pulse durations at a fluence of six times the optical breakdown threshold fluence. The transmission was approximately 50% for ultrashort pulse durations < 300 fs, maximal 80% for a pulse duration of 3 ps, and lower than 10% for pulse durations exceeding 5 ns 19. Here the large variation of the transmission through the optical breakdown volume was attributed to the interplay of the laser pulse duration and the characteristic time to reach the critical electron density. For ultrashort pulse durations < 300 fs, the leading edge of the laser pulse rapidly generates the critical electron density mainly by multiphoton ionization and a large portion of the pulse energy (~ 50%) is absorbed by the emerging plasma. At higher pulse durations ranging from a few ps to a few tens of ps, multiphoton ionization becomes less pronounced and the predominant plasma formation mechanism is cascade ionization. The cascade ionization process proceeds slower compared to multiphoton absorption and only the trailing edge of the pulse experiences plasma absorption and thus a larger portion of the pulse energy (~ 80%) is transmitted through the optical breakdown volume. In the case of nanosecond pulses, the critical electron density is already reached within the leading edge of the laser pulse through cascade ionization. Similar to ultrashort pulses, the subsequent portion of the laser pulse is then absorbed in the laser generated plasma and a smaller transmission (~ 10%) is the result 19.
NPs that are present in the liquid can significantly lower the threshold fluence for the optical breakdown of ns pulses19. It was demonstrated that for water, irradiated at a pulse duration of 1 ns and a wavelength of 1064 nm, the breakdown threshold of 100 J/cm² decreases to ~20 J/cm² by impurities in the liquid19.
LAL performed with ultrashort laser pulses ranging from tens of femtoseconds to a few picoseconds is often accompanied by non-linear effects such as the optical Kerr effect20. When the losses induced by non-linear effects and optical breakdown are combined, up to 70% of the pulse energy may be extinct before reaching the target surface20. Furthermore, there are attempts to account for NP concentration-dependent shielding effect21-23. Even at low concentrations of 50 mg/L, 25% of the laser energy is shielded by NPs21, 22.
Independent whether the ablation is performed in gases or in liquids, a reduction of the deposited laser energy is caused by interactions with the ablation dynamics. These interactions include plasma shielding24 as well as shielding by and re-deposition of the ablation plume25. In the case of LAL, however, an additional ablation dynamics induced loss mechanisms must be considered. After the laser pulse irradiates the target, a dense vapor layer is formed from which a cavitation bubble emerges. Consequently, the laser pulses are also shielded by the forming vapor above the target surface and, later, the cavitation bubble. In a study with a 9 ns laser, the shielding at an early stage of the laser pulse was investigated after the irradiation of an Au target immersed in water26. Here, approximately 0.3 ns after laser pulse impact, scattering of the laser pulse first by critical opalescence and later by nucleation was observed.
It was found that the ablation efficiency, which we define as the ablated NP mass per time (productivity) divided by the laser power varies strongly depending on the experimental conditions. This value is typically in the order of 1–10 mg/(hW) for high repetition rate lasers operating in the liquid flow regime2, and reaches 47 mg/(hW) under optimized conditions13. Such time-averaged values have been differentiated from single pulse ablation efficiency via single-pulse ns-LAL of six different elements, where a factor of 10 or higher volume ablation efficiency has been achieved compared to multi-pulse LAL27. It was shown recently that the efficiency is maximal for laser systems operating at a pulse duration of one nanosecond, when compared with a few ps or >5 ns 15, but neither a mechanistic explanation has been given nor single-pulse conditions were applied. Here, the highest ablation efficiencies were observed at a fluence of about 1 J/cm² for the ps laser and at 5–10 J/cm² for ns lasers. Consequently, when working at the optimal fluence, optical breakdown only contributes to the laser energy loss during ps ablation, while the predominant loss mechanism for ns laser pulses is shielding by the emerging vapor and cavitation bubble. Additionally, a decrease in productivity with increasing ns pulse duration is observed in the literature28, 29. Thus, it is hypothesized that vapor formation sets in between 1 and 5 ns after the pulse, resulting in minimal losses for LAL with pulse durations of ~1 ns. At this point it should be emphasized that the optimal pulse duration of ~1 ns is readily available by Q-switching of short-cavity laser resonators. Here cavity-length limited minimal pulse durations of a few 100 ps to 2 ns can be generated30. Thus optimal LAL processing may be possible utilizing low-cost Q-switched lasers, avoiding the high investment cost of mode-locked femto- and picosecond lasers.
To test the hypothesis of negligible shielding at a pulse duration of ~1 ns, we first determine the losses of laser energy during LAL of gold (Au) for different pulse durations and compare the results to ablation in air to quantify the pulse duration-dependent efficiency loss in water. Afterward, the temporal occurrence of the ablation plume is examined by pump-probe microscopy (PPM) of Au immersed in air and in water. We additionally analyze the response of silver (Ag) and platinum (Pt) to identify whether the onset of ablation plume formation is material-dependent.
Materials and methods
Ag, Au, and Pt bulk samples with a thickness of 1 mm and a purity >99.99% were used throughout the experiments. The samples were first embedded in a resin matrix and subsequently sanded and polished. An arithmetic average surface roughness Ra31 of approximately 10 nm was achieved, ensuring a smooth optical surface for the applied imaging techniques. All experiments were performed with single-pulses under ambient air conditions and in deionized water with a liquid layer height of 4 mm. Single-pulses were chosen to avoid shielding of successive pulses by NPs and microbubbles17.
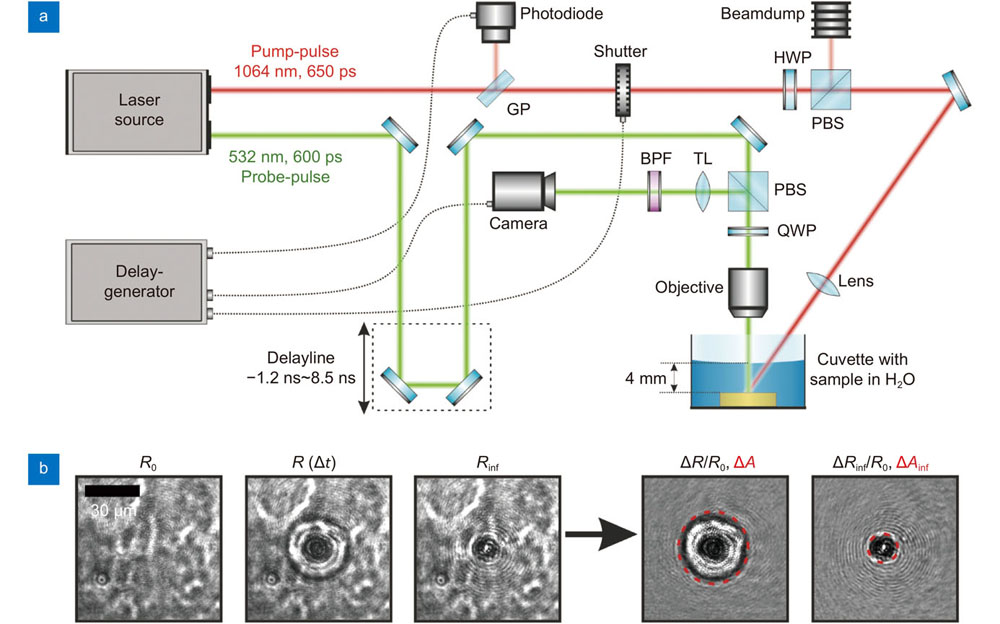
Figure 1(a) depicts the experimental PPM setup32. The laser (picoloAOT, InnoLas Laser) simultaneously emits pump- and probe-pulses with a repetition rate of frep = 500 Hz. The pump-pulses that induce the ablation process were centered at a wavelength of 1064 nm with a pulse duration of 650 ps (FWHM). Frequency-doubled probe-pulses used for illumination were centered at 532 nm with a pulse duration of 600 ps (FWHM).
Figure 1.(a) Pump-probe microscopy setup for the ablation in water. For the analysis of the ablation process in air, no cuvette is used, otherwise the setup is the same. (b) Image post processing of the three recorded images. The images of the pristine surface (R0), during the ablation process (R(Δt)) and after the ablation process has finished (Rinf) were used to calculate the transient (ΔR/R0) and final state (ΔRinf/R0) relative reflectivity change. The red dashed circles mark the transient laser-modified area ΔA and the final laser-modified area ΔAinf.
A glass plate (GP) partially reflected the pump-pulses onto a photodiode (DET10A2, Thorlabs), which served as a trigger source for temporal synchronization. A mechanical shutter (LS6S2TO-NL, Uniblitz Electronics) then selected a single pulse from the pulse train, which was guided through a half-wave-plate (HWP) polarization beam splitter (PBS) combination to adjust the pulse energy. Finally, the single pump-pulses were focused onto the sample surface at an incidence angle of 35° by a plano-convex lens with a focal length of f = 75 mm. The resulting elliptical laser spot on the sample surface with a minor beam waist radius of wmin = (12 ± 1) µm and a major beam waist radius of wmaj = (15 ± 1) µm was characterized by a focal beam profiler (MicroSpotMonitor, Primes) at 1/e2 intensity level. The peak fluences Φ0 were calculated by:
Here, the average laser output power P of the 500 Hz pulse train was measured after the focusing lens using a power meter (PS10Q, Coherent). Note that all peak fluences mentioned throughout this manuscript refer to incident peak fluences in air.
The delay time Δt between the probe-pulse and pump-pulse was realized with a motorized optical delay line, which allowed for the adjustment of Δt between –1 ns and 8.5 ns in steps of 0.1 ns. After passing a quarter-wave-plate (QWP) PBS combination, the probe-pulse imaged the ablation process at normal incidence onto a CCD camera (pco.pixelfly usb, PCO) through a long working distance microscope objective (50x, NA = 0.42; M Plan Apo 20, Mitutoyo) and a tube lens (TL). A bandpass filter (BPF) centered at (532 ± 5) nm was located in front of the camera to suppress undesired pump- and plasma-radiation. The shutter and camera were temporally synchronized to the photodiode trigger signal with a delay-generator (DG645, Stanford Research Systems).
For each Δt, the sample was translated to irradiate a pristine surface and three images were acquired at different times. The reference image (R0) was recorded 5 s before the pump-pulse’s arrival showing the unirradiated surface, which allowed the measurement of the initial target reflectivity. Afterward, an image at the desired delay time Δt (R(Δt)) was taken. This image was used to analyze the temporal change in the surface morphology and reflectivity, i.e. transient reflectivity. Finally, an image (Rinf) was taken 5 s after pump-pulse impact, which was used to determine the final reflectivity of the changed target surface and the resulting target morphology change, i.e. crater size. The transient and final relative surface reflectivity change ΔR/R0 and ΔRinf/R0 were calculated for each pixel by the following equations:
This process is illustrated in Fig. 1(b) at a delay time of Δt=8 ns after irradiation of Au in water with an incident fluence of 8 J/cm2. All ΔR/R0 curves presented throughout this manuscript were obtained by averaging ΔR/R0 over an area of 20 × 20 pixels, located in the center of the irradiated region. Since the laser modification exhibits an irregular shape, the transient laser-modified area ΔA and the final state laser-modified area ΔAinf were determined (see red dashed circles in Fig. 1(b)) rather than the diameter or radius of the modification.
It should be noted that even though the delay time increment was set to 0.1 ns, the temporal resolution of the PPM setup and hence of the reflectivity dynamics is determined by the probe pulse duration of 600 ps. For any given Δt, the measured reflectivity signal presents a convolution of the temporal probe-pulse profile and the actual transient reflectivity change occurring within the probe-pulse duration. In this context, the relative reflectivity change at each Δt does not reflect the reflectivity dynamics occurring at this exact instant of time but rather includes contributions of the dynamic surface reflectivity from a time interval of 600 ps. Therefore, fast transient processes that occur on timescales shorter than the applied probe-pulse duration cannot be resolved with this setup.
Results
Figure 2 displays the maximal multi-pulse ablation efficiency of Au in air (light colored bars) and water (dark colored bars) for pulse durations of 3 ps (blue bars), 1 ns (green bars), and 7 ns (orange bars). In general, the ablation efficiency is calculated in units of µg/(W·s) by dividing the ablation rate in µg/s by the used laser power in W, as outlined in ref.15. In the case of LAL, the bars are divided into two sections. The solid sections present the ablation efficiency calculated using the laser power measured in front of the ablation chamber. Hatched sections show the efficiency increase calculated when using the laser power that reaches the target surface, i.e. when considering linear absorption and reflection losses. No further energy dissipation channel was taken into account for this calculation. The linear absorption in the liquid and the reflection at the ablation chamber entrance window were calculated using the optical properties listed in ref.15.
Compared to ablation with ns pulses, the water layer has a large influence on the ablation efficiency when ps pulses are applied. Here the maximal ablation efficiency of 40.7 ± 0.8 µg/(W·s) in air drops by approximately 90% to a value of 5.0 ± 0.1 µg/(W·s) in water. For the 1 ns laser, a negligible influence of the water layer on the ablation efficiency is observed. At this pulse duration, comparable maximal ablation efficiencies with respective values of (17.0 ± 0.7) µg/(W·s) and (17.1 ± 0.4) µg/(W·s) are reached in air and water. Ablation with a 7 ns laser results in a 30% decrease of the ablation efficiency from 19.7 ± 5.0 µg/(W·s) in air to 13.7 ± 1.1 µg/(W·s) in water.
Figure 2.Maximal ablation efficiency for the ablation of gold in air (light-colored, solid bars) and water (dark-colored bars) for lasers of 3 ps (blue, ~2 J/cm² and 100 µJ/pulse), 1 ns (green, ~8 J/cm² and 130 µJ/pulse), and 7 ns (orange, ~13 J/cm² and 400 µJ) pulse duration with data from ref.10 where the ablation efficiency is calculated with the incident laser energy (dark-colored, solid bar) and under consideration of the linear energy extinction by the water layer (dark-colored, hatched bar). The error bars represent the statistical error.
The findings of the PPM experiments are presented in Fig. 3. The data was obtained by irradiating an Au target in air (black open triangles) and in water (blue open circles). Pump-pulses with a pulse duration of 650 ps and an incident peak fluence of 8 J/cm2 are indicated by red areas. From the recorded images (Fig. 3(a)) the relative reflectivity change ΔR/R0 (Fig. 3(b)) and the transient laser-modified area ΔA (Fig. 3(c)) were obtained. The final state laser-modified area ΔAinf after the ablation is depicted at the Δt labeled “inf” and was (170 ± 20) µm2 in air and (120 ± 20) µm2 in water.
Figure 3.(a) Exemplary microscopy images at different delay times are displayed . Time-dependent change in (b) the relative reflectivity ΔR/R0 and (c) the transient laser-modified area ΔA of the Au target surface for PPM in air (black open symbols) and water (blue open symbols) after irradiation with 650 ps pulses at 8 J/cm². The final laser-modified areas ΔAinf are depicted at the Δt labeled “inf” and the pump-pulses are indicated by red areas. The blue solid vertical line marks the characteristic Δt where ΔA exceeds its final state value ΔAinf.
For Δt > –0.5 ns, Δ R/R0 stays approximately constant at the zero level. When the delay time increase beyond 0 ns, a pronounced decrease of ΔR/R0 to a minimum of -0.9 and -0.8 at delay times of 1 ns is observed in air and water, respectively. This decrease is accompanied by an expansion ofΔA. After the initial decrease, ΔR/R0 recovers to a value of –0.5 at Δt ≈ 2 ns. During this recovery, ΔA stays approximately constant. When the delay time of 2 ns is exceeded, oscillations of ΔR/R0 are observed over the remaining investigated temporal range. In the case of air ΔR/R0 oscillates between values of –0.6 and –0.2, while in water ΔR/R0 oscillates between values of –0.7 and –0.3. Within this time interval, ΔA stays constant at the final state value for laser ablation in air. However, in the case of ablation in water, this characteristic delay time (blue solid vertical line in Fig. 3(c)) marks the point after which ΔA begins to exceed the final state value ΔAinf.
From this characteristic time onwards, it is possible to distinguish between the relative reflectivity change occurring on the sample surface and the relative reflectivity change induced by the outward propagating ablation plume. By averaging over the instantaneous velocities within the temporal interval ranging from the characteristic Δt of 2 ns up to the longest investigated Δt of about 8.5 ns, we calculate a radial expansion velocity of approximately (1700 ± 200) m/s in water. The oscillatory features of ΔA for delay times ranging between 4 ns and 8 ns are attributed to statistical fluctuations of the vapor/cavitation bubble propagation.
To evaluate the material-dependent response to the laser pulse, pump-probe microscopy experiments at a pump-pulse peak fluence of 8 J/cm2 have been performed for Ag and Pt in water. Figure 4 depicts ΔA as a function Δt for Ag (blue open squares) and Pt (blue solid triangles). The pump-pulse is displayed with a red area and the final state values are displayed at the Δt labeled “inf”.
Figure 4.Transient laser-modified area ΔA for PPM of Ag (blue open squares) and Pt (blue solid triangles) targets at 8 J/cm2. The final state values of the laser-modified area are depicted at the Δt labeled “inf” and the pump-pulse is indicated by a red area. Blue dashed and solid vertical lines mark the Δt where ΔA exceeds the final state value for Ag and Pt, respectively.
For both materials it can be observed that ΔA begins to increase when a delay time of zero is exceeded. At delay times of Δt ≈ 0.7 ns (blue dashed vertical line) and Δt ≈ 1.5 ns (blue solid vertical line) ΔA has exceeded the final state values of (170 ± 40) µm2 and (580 ± 60) µm2 for Ag and Pt, respectively. The rapid increase of ΔA over the remaining investigated delay time range occurs with a radial expansion velocity of (1840 ± 140) m/s in the case of Ag and with approximately (1650 ± 100) m/s in the case of Pt.
Discussion
In order to put the measured ablation dynamics in context, the different mechanisms leading to energy loss during LAL are discussed and compared to our findings. For the ablation efficiencies presented in Fig. 1, the linear absorption has been considered. Therefore, the remaining losses can be attributed only to optical breakdown and shielding by the emerging plasma, plume, vapor and cavitation bubble. It is observed, that the remaining loss mechanisms are most pronounced for 3 ps pulses (90% efficiency loss), followed by 7 ns pulses (30% efficiency loss), and are neglectable for 1 ns pulses (Fig. 115).
The optical breakdown threshold fluences of water for near-infrared laser pulses are about 1–13.5 J/cm2 for 3 ps pulses and 100–300 J/cm2 for nanosecond pulses19. Thus, only for ablation with the 3 ps pulse but not for the 1 ns and 7 ns, the optical breakdown threshold fluence in water is exceeded in our experiments.
Following the observation of Starinskiy et al.26, it is hypothesized that for pulse durations of several hundred ps to 1 ns, the laser pulse is shorter than the starting time for vapor layer formation. Thus, this loss mechanism can be excluded for 3 ps pulses. Based on this, the sole loss mechanisms for 3 ps pulses is optical breakdown, while plasma, plume, vapor and cavitation bubble shielding remain for 1 ns and 7 ns pulses. Significant plasma shielding occurs when the electron density in the laser generated plasma exceeds the critical electron density. In the case of near-infrared irradiation used here, the critical electron density is of the order of 1021 cm−319. Compared to ablation in air, the electron densities within the plasma generated during LAL are approximately one order of magnitude higher, ranging between 1018 and 1020 1/cm333, which is still one order of magnitude below the critical electron density. However, the electron densities in ref.33 were determined approximately 50 ns after pulse impact and higher electron densities might be reached during laser pulse irradiation. Additionally, the critical electron density may also be generated by the interplay of the plasma generated by material ablation initiated by the leading edge of the laser pulse and subsequent cascade ionization by the trailing edge of the laser pulse. On the contrary, it was previously reported that the plasma present in LAL could enhance the ablation rate via additional etching by reactive plasma species33.
Re-deposition of and shielding by the generated ablation plume has been extensively investigated for ablation in air25, 34. It was found that a pronounced re-deposition only occurs when the material is ejected in the form of a spallation layer, which forms a sharp Fresnel-like boundary with the surrounding atmosphere25. However, photo-mechanical spallation is only observed for ultrashort pulse durations33, while in the case of ns-LAL material is ejected in the form of a discontinuous gas-liquid mixture. Simulations predict that this gas-liquid mixture starts expanding significantly above the sample surface when delay times of approximately 2 ns are exceeded35. Following this, the remaining loss mechanisms for the 7 ns pulse are plume, vapor and cavitation bubble shielding, while the ablation process should proceed unperturbed for the 1 ns pulse.
In order to support the hypothesis that plume, vapor and cavitation bubble shielding limits the ablation efficiency for 7 ns LAL, while for 1 ns LAL no such limitations are present, the pump-probe microscopy measurements of Au will be discussed in detail. First, it was observed that the surface reflectivity in air and water do not differ significantly for Δt < 1 ns ( Fig. 3(b)). For PPM with a pump-pulse duration of 500 fs, the reflectivity change was more extensive in air than in water36. However, this may be attributed to the higher amount of laser energy, reaching the target for ablation in air since filamentation occurred in water. Furthermore, it was shown that the ablation mechanisms and dynamics of ultrashort LAL differ significantly from those during ns-LAL as the conditions for thermal and stress confinement are no longer fulfilled for ns-LAL35. Thus, the difference between the ablation dynamics reported for 500 fs pump-pulses in ref.36 and the results presented here with a pump-pulse duration of 650 ps may be attributed to different ablation mechanisms due to variation of the pulse duration.
For ns-LAL the reflectivity change in water is more pronounced than in air due to supercritical water layer formation and an emerging vapor layer26. The time scale of the supercritical water layer formation is dependent on the laser fluence. The formation starts already during the 9 ns laser beam’s rising edge and fluences near the damage threshold26. Since, in our experiments, the threshold fluence is exceeded about 4–5 times15, a very early vapor formation, i.e., reflectivity decrease, is expected.
Next, we observed that for irradiation in air, ΔA expands up to a delay time of 2 ns, where it reaches the final state value of 170 µm². However, for irradiation in water ΔA reaches the final state value of 120 µm² at a delay time of 2 ns and then proceeds to increase continuously up to our maximum observeation time of 8.5 ns (Fig. 3(a), 3c).
After reaching the final spot diameter, the spot area remains constant of Au in air, whereas in water it expands with 1700 m/s in the observed time range (Mach number > 1). The shockwave propagation velocity for delay times between 0.2–2 µs after laser pulse impact was measured to be 1700 m/s for Cu (8 ns pulse width, 68 J/cm 240), or silica (50 fs pulse width, at ten times the threshold fluence41) in the literature. At a very early stage of the cavitation bubble formation, the cavitation bubble seems to be attached to the shockwave since it moves and propagates along with the shockwave42. The simultaneous expansion of the cavitation bubble and shockwave explains the observation of Mach cones at early stages (50 fs pulse width, 1.58 J/cm241, 8 ns pulse width43, 13 ns pulse width44). In the literature, for the ablation of Ti with a fluence of 68.5 J/cm², the detachment of the shockwave from the bubble is observed between a delay time of 20–52 ns45 and between 6–27 ns at 29.8 J/cm246. Further investigations using shadowgraphy show the difference in the temporal evolution of ablation of epoxy-resin in air and in water for delay times >10 ns 47.
Later, the cavitation bubble expansion is drastically decreased to, e.g., 50 m/s at a delay time of 0.5–5.0 µs48. All observations combined lead to the conclusion that for the first 2 ns of ablation of Au in water we observe a supersonic expansion. Since, in this time frame, ΔR/R0 and ΔA are comparable for the ablation in water and air, we assume that similar processes occur such as material modification. The laser beam energy loss is presumably equal for water and air in this time frame. Only after delay times >2 ns, the vapor layer has detached from the shockwave and, at this early stage, propagates with sonic velocity for the first 9 ns of the ablation process. Consequently, the ablation efficiency for ablation in air and water, under consideration of absorption by the liquid, is equal if the laser pulse has passed before expansion of the ablation plume occurs, which in the case of Au is 2 ns after the laser pulse maximum.
Since laser absorption is a material-dependent property, we additionally analyzed the material response for Ag and Pt samples within the first 9 ns. For both sample materials, the characteristic delay time, at which ΔA increases beyond its final crater size, is reduced compared to ablation of Au in water. Here characteristic delay times of 0.7, 2.0 and 1.4 ns were observed for Ag, Au, and Pt. This result shows that the optimal LAL pulse duration strongly depends on the materials used. The ΔA change (Fig. 4) starts first for the Pt sample (0 ns), revealing the largest final spot area of 584 µm2. For Ag and Au (Fig. 3(c) and Fig. 4), the surface change starts at 0.2 ns and exhibits a smaller final spot area than Pt. This order coincides with the metals’ absorption coefficients at 1064 nm, which are 8.99×105 cm–1 for Ag49, 8.22×105 cm–1 for Au49, and 13×105 cm–1 for Pt50. In the literature, it is observed that a coating, which increased the absorptivity, causes stronger stress waves in the sample material and leads to a faster shockwave and vapor expansion51, which supports our observations. Although the energy absorption for the three materials is different, the radial expansion velocity is close to 1700 m/s for all three materials. The value of 1700 m/s was also observed for the ablation of Cu wires in water (8 ns, 68 J/cm2)40. With 1200 m/s the radial expansion velocity is slower for Pd ablation in acetone (250 fs, 7 J/cm2)48.
Finally, the experimental results are in good agreement with computational predictions. Shih et al. investigated LAL of an Ag target at an absorbed fluence of 0.6 J/cm2 and pulse durations of 400 ps, 1 ns and 2 ns by means of atomistic simulations35. Their findings indicate that the material is rapidly ejected and subsequently confined by the surrounding water within a few 100 ps. Within this initial confinement stage, a sharp boundary remains between the ejected ablation plume and the water confinement layer. Here the authors predict negligible shielding of the laser pulse by the ablation plume. However, a few nanoseconds after pulse impact, the sharp interface begins to decompose into vapor, small atomic clusters and droplets located within a metal-water mixing region. At this stage a sharp interface between the ablation plume and the liquid confinement layer is no longer present and the ablation plume may shield the laser pulse. In fact, their simulations predict that a 400 ps laser pulse is short enough to not experience any shielding within the metal-water mixing region. For longer pulse durations of 1 ns and 2 ns, the decomposition of the sharp interface already happens at the tail of the laser pulse and shielding by the ablation plume must be considered. The computational predictions are in accordance with our results as we observe that ablation plume shielding during LAL of Ag starts for pulse durations exceeding the characteristic time of approximately 700 ps (Fig. 4).
Conclusion
Laser ablation synthesis of colloids in liquids is a promising nanomaterial fabrication method but high laser investments costs require the efficient use of laser energy, avoiding pulse attenuation during ablation, and finding the most efficient pulse duration regime. Short pulsed LAL at around 10 ns pulse duration is of similar efficiency compared to ultrashort pulsed LAL, as in both cases, intra-pulse attenuation caused either by the liquid or plume, vapor and cavitation bubble limits efficient energy deposition. It is demonstrated that pump-probe microscopy gives valuable insight into laser ablation mechanisms for targets immersed in air and water. The comparison of the transient laser-modified area with the laser-modified area in the final state allows us to confirm the hypothesis of negligible intra-pulse plume, vapor and cavitation bubble shielding for ablation with 1 ns laser pulses. Furthermore, we are able to determine characteristic shielding times which translate into optimal laser pulse durations. If the optimal pulse durations are met, shielding of the trailing edge of the laser pulse by plume, vapor and cavitation induced by the leading edge of the laser pulse is avoided. Consequently, the reduction of shielding effects during the laser pulse irradiation increases the ablation efficiency observed for 1 ns LAL of Au. The characteristic shielding times are approximately 2 ns, 0.7 ns and 1.4 ns for Au, Ag and Pt, respectively. Hence cavity-length limited, Q-switched nanosecond lasers (such as fiber or microchip lasers) may have high potential in advancing LAL to even higher efficiencies, with the practical and ecological perspective that such lasers are comparable compact and electro-optically energy-efficient.
References
[24] Aguilera JA, Aragón C, Pealba F. Plasma shielding effect in laser ablation of metallic samples and its influence on LIBS analysis. Appl Surf Sci127–129, 309–314 (1998);https://doi.org/10.1016/S0169-4332(97)00648-X.
[30] Koechner W, Bass M. Solid-State Lasers (Springer, New York, 2003); https://doi.org/10.1007/b97423.
Sarah Dittrich, Maximilian Spellauge, Stephan Barcikowski, Heinz P. Huber, Bilal Gökce. Time resolved studies reveal the origin of the unparalleled high efficiency of one nanosecond laser ablation in liquids[J]. Opto-Electronic Advances, 2022, 5(6): 210053