• High Power Laser Science and Engineering
  • Vol. 9, Issue 4, 04000e58 (2021)
Rumao Tao*, Yu Liu, Lianghua Xie, Cong Gao, Min Li, Benjian Shen, Shan Huang, Honghuan Lin, Jianjun Wang, and Feng Jing
Author Affiliations
  • Laser Fusion Research Center, China Academy of Engineering Physics, Mianyang 621900, China
  • show less
    DOI: 10.1017/hpl.2021.44 Cite this Article Set citation alerts
    Rumao Tao, Yu Liu, Lianghua Xie, Cong Gao, Min Li, Benjian Shen, Shan Huang, Honghuan Lin, Jianjun Wang, Feng Jing. Static and dynamic mode evolution in high-power distributed side-coupled cladding-pumped fiber amplifiers[J]. High Power Laser Science and Engineering, 2021, 9(4): 04000e58 Copy Citation Text show less
    Schematic diagram of DSCCP fiber with one pump core.
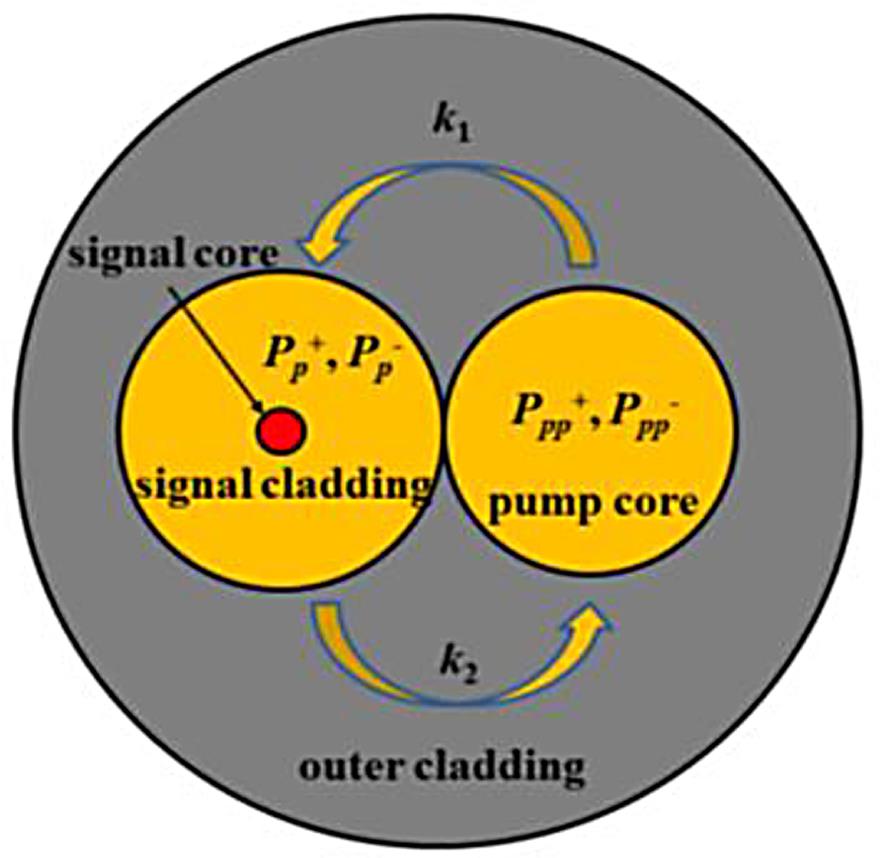
    Fig. 1. Schematic diagram of DSCCP fiber with one pump core.
    (a) Power distribution and (b) fraction of the HOM in the DSCCP fiber amplifier.
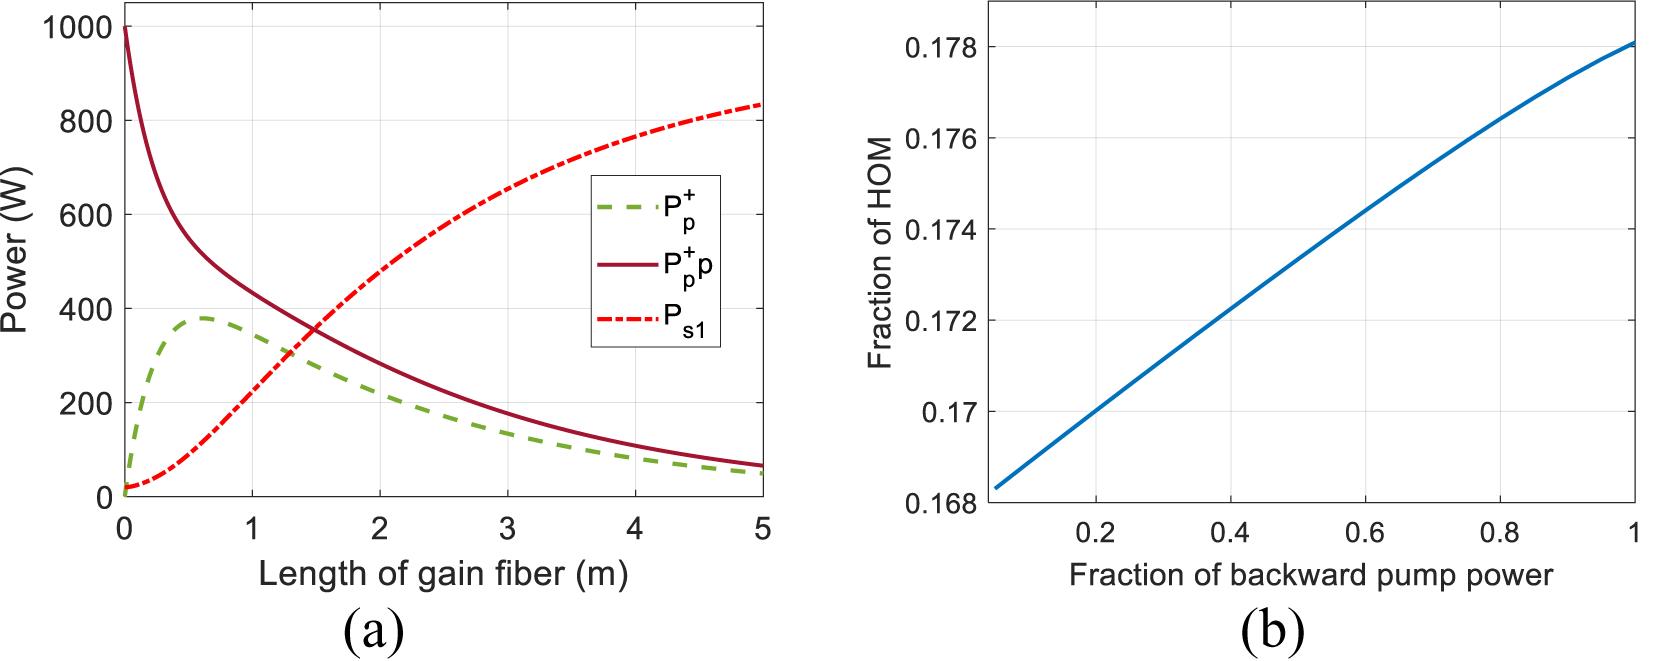
    Fig. 2. (a) Power distribution and (b) fraction of the HOM in the DSCCP fiber amplifier.
    (a) Fraction of the HOM as a function of backward pump power ratio under different pump powers. (b) Normalized data of (a). (c) Fraction of the HOM as a function of the backward pump power ratio under different fiber lengths in the DSCCP fiber amplifier.
    Fig. 3. (a) Fraction of the HOM as a function of backward pump power ratio under different pump powers. (b) Normalized data of (a). (c) Fraction of the HOM as a function of the backward pump power ratio under different fiber lengths in the DSCCP fiber amplifier.
    (a) Fraction of the HOM and (b) normalized fraction of the HOM as a function of backward pump power ratio under different cladding sizes. (c) Fraction of the HOM and (d) normalized fraction of the HOM as a function of backward pump power ratio under different core sizes. (e) Fraction of the HOM and (f) normalized fraction of the HOM as a function of backward pump power ratio for 5 W seed power. (g) Fraction of the HOM and (h) normalized fraction of the HOM as a function of backward pump power ratio for k = 20 m–1.
    Fig. 4. (a) Fraction of the HOM and (b) normalized fraction of the HOM as a function of backward pump power ratio under different cladding sizes. (c) Fraction of the HOM and (d) normalized fraction of the HOM as a function of backward pump power ratio under different core sizes. (e) Fraction of the HOM and (f) normalized fraction of the HOM as a function of backward pump power ratio for 5 W seed power. (g) Fraction of the HOM and (h) normalized fraction of the HOM as a function of backward pump power ratio for k = 20 m–1.
    (a) Fraction of HOM as a function of backward pump power ratio for different gain fibers; (b) normalized data of (a).
    Fig. 5. (a) Fraction of HOM as a function of backward pump power ratio for different gain fibers; (b) normalized data of (a).
    (a) Fraction of the HOM as a function of backward pump power ratio for different dopant concentrations. (b) Normalized data of (a). (c) Fraction of the HOM as a function of backward pump power ratio for different dopant concentrations with k = 4 m–1 and L = 2.5 m.
    Fig. 6. (a) Fraction of the HOM as a function of backward pump power ratio for different dopant concentrations. (b) Normalized data of (a). (c) Fraction of the HOM as a function of backward pump power ratio for different dopant concentrations with k = 4 m–1 and L = 2.5 m.
    The HOM fraction as a function of output signal power for the evenly bi-directional pumping case in Ref. [26].
    Fig. 7. The HOM fraction as a function of output signal power for the evenly bi-directional pumping case in Ref. [26].
    (a) Threshold signal power as a function of backward pump power fraction. (b) Threshold signal power as a function of seed power. (c) Threshold signal power as a function of total pump absorption. (d) Threshold signal power as a function of core diameter. (e) Threshold signal power as a function of cladding diameter. (f) Threshold signal power as a function of average coupling coefficient.
    Fig. 8. (a) Threshold signal power as a function of backward pump power fraction. (b) Threshold signal power as a function of seed power. (c) Threshold signal power as a function of total pump absorption. (d) Threshold signal power as a function of core diameter. (e) Threshold signal power as a function of cladding diameter. (f) Threshold signal power as a function of average coupling coefficient.
    (a) Threshold signal power as a function of backward pump power fraction for different cladding sizes. (b) Normalized threshold signal power as a function of backward pump power fraction for different cladding sizes. (c) Threshold signal power as a function of backward pump power fraction for different core sizes. (d) Normalized threshold signal power as a function of backward pump power fraction for different core sizes.
    Fig. 9. (a) Threshold signal power as a function of backward pump power fraction for different cladding sizes. (b) Normalized threshold signal power as a function of backward pump power fraction for different cladding sizes. (c) Threshold signal power as a function of backward pump power fraction for different core sizes. (d) Normalized threshold signal power as a function of backward pump power fraction for different core sizes.
    (a) Threshold signal power as a function of fiber length for backward pump power fraction of 0 corresponding to the co-pumping scheme. (b) Backward pump power fraction of 0.5 corresponding to the bi-directional-pumping scheme. (c) Backward pump power fraction of 1 corresponding to the counter-pumping scheme. (d) Threshold signal power as a function of the backward pump power fraction.
    Fig. 10. (a) Threshold signal power as a function of fiber length for backward pump power fraction of 0 corresponding to the co-pumping scheme. (b) Backward pump power fraction of 0.5 corresponding to the bi-directional-pumping scheme. (c) Backward pump power fraction of 1 corresponding to the counter-pumping scheme. (d) Threshold signal power as a function of the backward pump power fraction.
    Threshold signal power as a function of coupling coefficient.
    Fig. 11. Threshold signal power as a function of coupling coefficient.
    (a) Threshold signal power as a function of fiber length for backward pump power fraction of 0.5. (b) Threshold signal power as a function of the backward pump power fraction for different fiber lengths. (c) Threshold signal power as a function of dopant concentration. (d) Threshold signal power as a function of the convection coefficient.
    Fig. 12. (a) Threshold signal power as a function of fiber length for backward pump power fraction of 0.5. (b) Threshold signal power as a function of the backward pump power fraction for different fiber lengths. (c) Threshold signal power as a function of dopant concentration. (d) Threshold signal power as a function of the convection coefficient.
    Schematic diagram of DSCCP fiber with two without-contact inner claddings.
    Fig. 13. Schematic diagram of DSCCP fiber with two without-contact inner claddings.
    (a) Threshold signal power and (b) normalized threshold signal power as a function of the backward pump power fraction for different pump cores.
    Fig. 14. (a) Threshold signal power and (b) normalized threshold signal power as a function of the backward pump power fraction for different pump cores.
    Schematic diagram of distributed side-coupled cladding-pumped fiber with two in-contact pump cores.
    Fig. 15. Schematic diagram of distributed side-coupled cladding-pumped fiber with two in-contact pump cores.
    Threshold signal power as a function of the backward pump power fraction.
    Fig. 16. Threshold signal power as a function of the backward pump power fraction.
    PhysicalPhysical
    symbolsValueReferencessymbolsValueReferences
    nclad1.45[51]RN(Ω)–100 dBc/Hz[8]
    NA0.065/ ${\sigma}_{\mathrm{p}}^{\mathrm{a}}$ 2.18 × 10⁻²⁴ m2[8]
    Rc15 μm/ ${\sigma}_{\mathrm{p}}^{\mathrm{e}}$ 2.18 × 10⁻²⁴ m2[8]
    R125 μm/ ${\sigma}_{\mathrm{s}}^{\mathrm{a}}$ 7.22 × 10⁻²⁷ m2[8]
    λp976 nm/ ${\sigma}_{\mathrm{s}}^{\mathrm{e}}$ 4.34 × 10⁻²⁵ m2[8]
    λs1064 nm/T901 μs[51]
    hq1000 W/(m2 K)[52]γ(r, ϕ, z)0/
    H1.2 × 10–5 K−1[51]P20 W/
    κT1.38 W/(K m)[51]ξ00.01/
    ρC1.54 × 106 J/(K m3)[51]
    Table 1. Parameters of the test amplifier.
    Threshold signal power (W)
    k3 (m–1)1.6 m3 m
    2.5735919
    10739923
    20741925
    Table 2. Mode instability threshold of DSCCP fiber with two in-contact pump cores.
    Threshold signal power (W)
    Fraction of backward pump power27.5 m51.7 m
    032003500
    0.544305350
    148005620
    Table 3. Mode instability threshold of DSCCP fiber with two in-contact pump cores.
    Rumao Tao, Yu Liu, Lianghua Xie, Cong Gao, Min Li, Benjian Shen, Shan Huang, Honghuan Lin, Jianjun Wang, Feng Jing. Static and dynamic mode evolution in high-power distributed side-coupled cladding-pumped fiber amplifiers[J]. High Power Laser Science and Engineering, 2021, 9(4): 04000e58
    Download Citation