• Photonics Research
  • Vol. 2, Issue 2, 71 (2014)
Qingzhong Deng1, Xinbai Li1, Zhiping Zhou1、*, and and Huaxiang Yi2
Author Affiliations
  • 1State Key Laboratory of Advanced Optical Communication Systems and Networks, School of Electronics Engineering and Computer Science, Peking University, Beijing 100871, China
  • 2Xi’an Flight Automatic Control Research Institute, Aviation Industries of China (AVIC), Xi’an 710065, China
  • show less
    DOI: 10.1364/PRJ.2.000071 Cite this Article Set citation alerts
    Qingzhong Deng, Xinbai Li, Zhiping Zhou, and Huaxiang Yi. Athermal scheme based on resonance splitting for silicon-on-insulator microring resonators[J]. Photonics Research, 2014, 2(2): 71 Copy Citation Text show less
    Schematic of proposed structure. Inset, ridge waveguide cross-section view; BOX, buried oxide layer; L, coupling length; κ(κ0), coupling coefficient; r(r0), self-coupling coefficient.
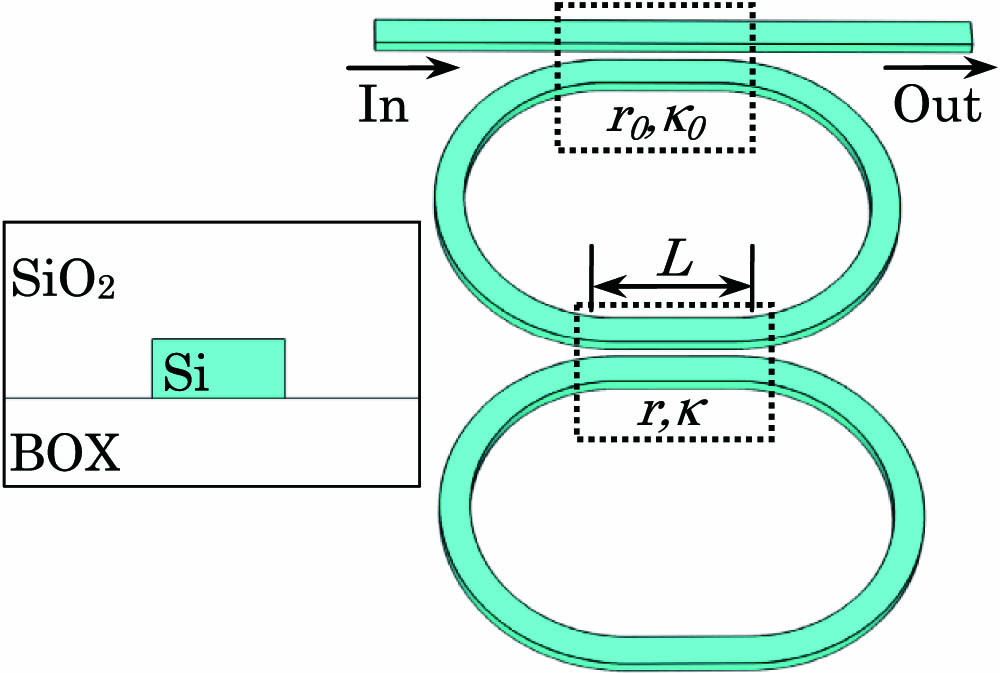
    Fig. 1. Schematic of proposed structure. Inset, ridge waveguide cross-section view; BOX, buried oxide layer; L, coupling length; κ(κ0), coupling coefficient; r(r0), self-coupling coefficient.
    (a) Resonance splitting in dual-ring structure. (b) Resonance wavelength detuning at different ring-to-ring coupling coefficient. λ0 is the central wavelength, representing resonance wavelength at κ=0; λ is the resonance wavelength; FSR stands for free spectral range. (c) dλ/dκ with respect to coupling coefficient, approximately constant in a wide range of κ=0–0.7.
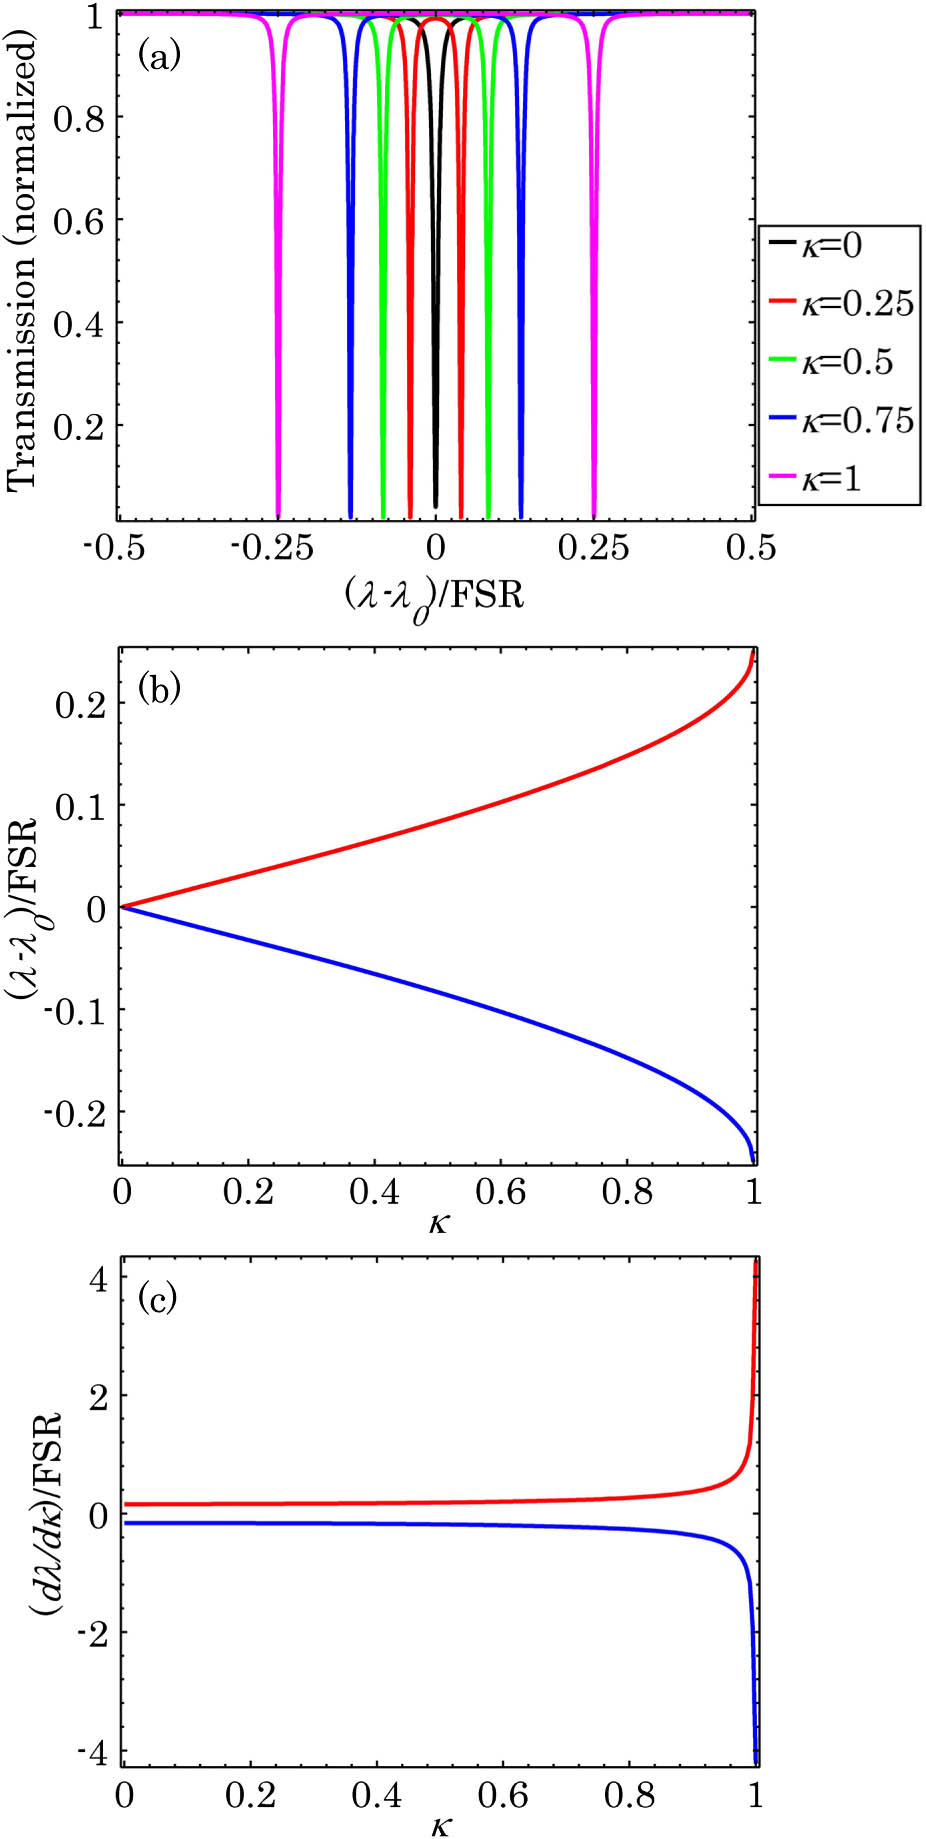
    Fig. 2. (a) Resonance splitting in dual-ring structure. (b) Resonance wavelength detuning at different ring-to-ring coupling coefficient. λ0 is the central wavelength, representing resonance wavelength at κ=0; λ is the resonance wavelength; FSR stands for free spectral range. (c) dλ/dκ with respect to coupling coefficient, approximately constant in a wide range of κ=00.7.
    Numerical analysis of (a) energy flux density (Pz) and (b) field Hy distribution in DC.
    Fig. 3. Numerical analysis of (a) energy flux density (Pz) and (b) field Hy distribution in DC.
    (a) Relations of coupling coefficient κ and (b) temperature sensitivity of coupling coefficient (dκ/dT) versus coupling length at different temperature. Dots, simulation results; line, fitting curve based on coupled mode theory.
    Fig. 4. (a) Relations of coupling coefficient κ and (b) temperature sensitivity of coupling coefficient (dκ/dT) versus coupling length at different temperature. Dots, simulation results; line, fitting curve based on coupled mode theory.
    Transmission spectra (a) without and (b) with resonance splitting.
    Fig. 5. Transmission spectra (a) without and (b) with resonance splitting.
    Relations of blue shift (blue line and dots) and resonance wavelength shift (red line and crosses) versus temperature. λ0 is the resonance wavelength at T=300 K, and λ is resonance wavelength.
    Fig. 6. Relations of blue shift (blue line and dots) and resonance wavelength shift (red line and crosses) versus temperature. λ0 is the resonance wavelength at T=300K, and λ is resonance wavelength.
    Qingzhong Deng, Xinbai Li, Zhiping Zhou, and Huaxiang Yi. Athermal scheme based on resonance splitting for silicon-on-insulator microring resonators[J]. Photonics Research, 2014, 2(2): 71
    Download Citation