
Jun XU, Yang XU, Lei HU, Zhenbo WANG. Discovering spatio-temporal patterns of human activity on the Qinghai-Tibet Plateau based on crowdsourcing positioning data [J]. Acta Geographica Sinica, 2020, 75(7): 1406
- Acta Geographica Sinica
- Vol. 75, Issue 7, 1406 (2020)
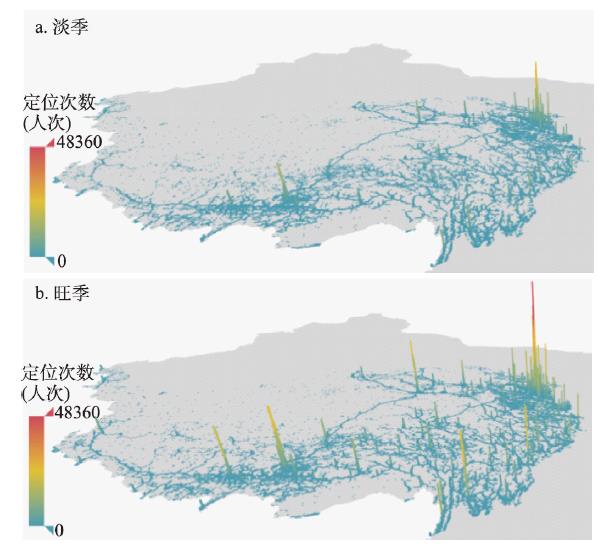
Fig. 1. 3D display of average daily positioning requests' distribution in off-season and peak season of tourism
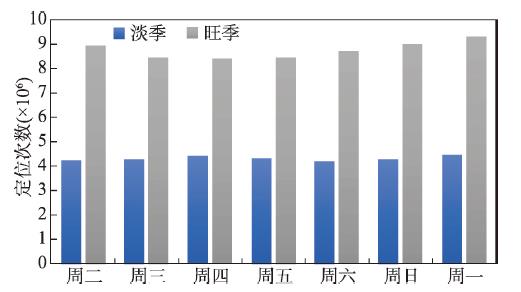
Fig. 2. Daily positioning request numbers in off-season and peak season of tourism
Fig. 3. Hourly positioning request numbers in off-season and peak season of tourism
Fig. 4. Tucker model of tensor decomposition
Fig. 5. Flowchart of the research
Fig. 6. Cost function values of different S-T-D compositions for dataset in off-season of tourism
Fig. 7. Cost function values of different S-T-D compositions for dataset in peak season of tourism
Fig. 8. Distributions of daily patterns in off-season and peak season of tourism
Fig. 9. Distributions of hourly patterns in off-season and peak season of tourism
Fig. 10. Cluster centroids of spatial patterns in off-season and peak season of tourism
Fig. 11. Clusters of spatial patterns in off-season and peak season of tourism
|
Table 1. Parameter selection for tucker decomposition
| ||||||||||||||||||||||||||||||||||||||||||||||||||||||||||||||||||||||||||||||||||||||||||||||||||||||||||||||||||||||||
Table 2. The core tensor of dataset in off-season of tourism
| ||||||||||||||||||||||||||||||||||||||||||||||||||||||||||||||||||||||||||||||||||||||||||||||||||||||||||||||||||||||||
Table 3. The core tensor of dataset in peak season of tourism

Set citation alerts for the article
Please enter your email address
© Copyright 2018-2021 | Chinese Laser Press. All Rights Reserved 沪ICP备15018463号-20