
Wei-Min Wang, Zheng-Ming Sheng, Yu-Tong Li, Jie Zhang, "Upper-limit power for self-guided propagation of intense lasers in underdense plasma," High Power Laser Sci. Eng. 1, 02000074 (2013)
- High Power Laser Science and Engineering
- Vol. 1, Issue 2, 02000074 (2013)
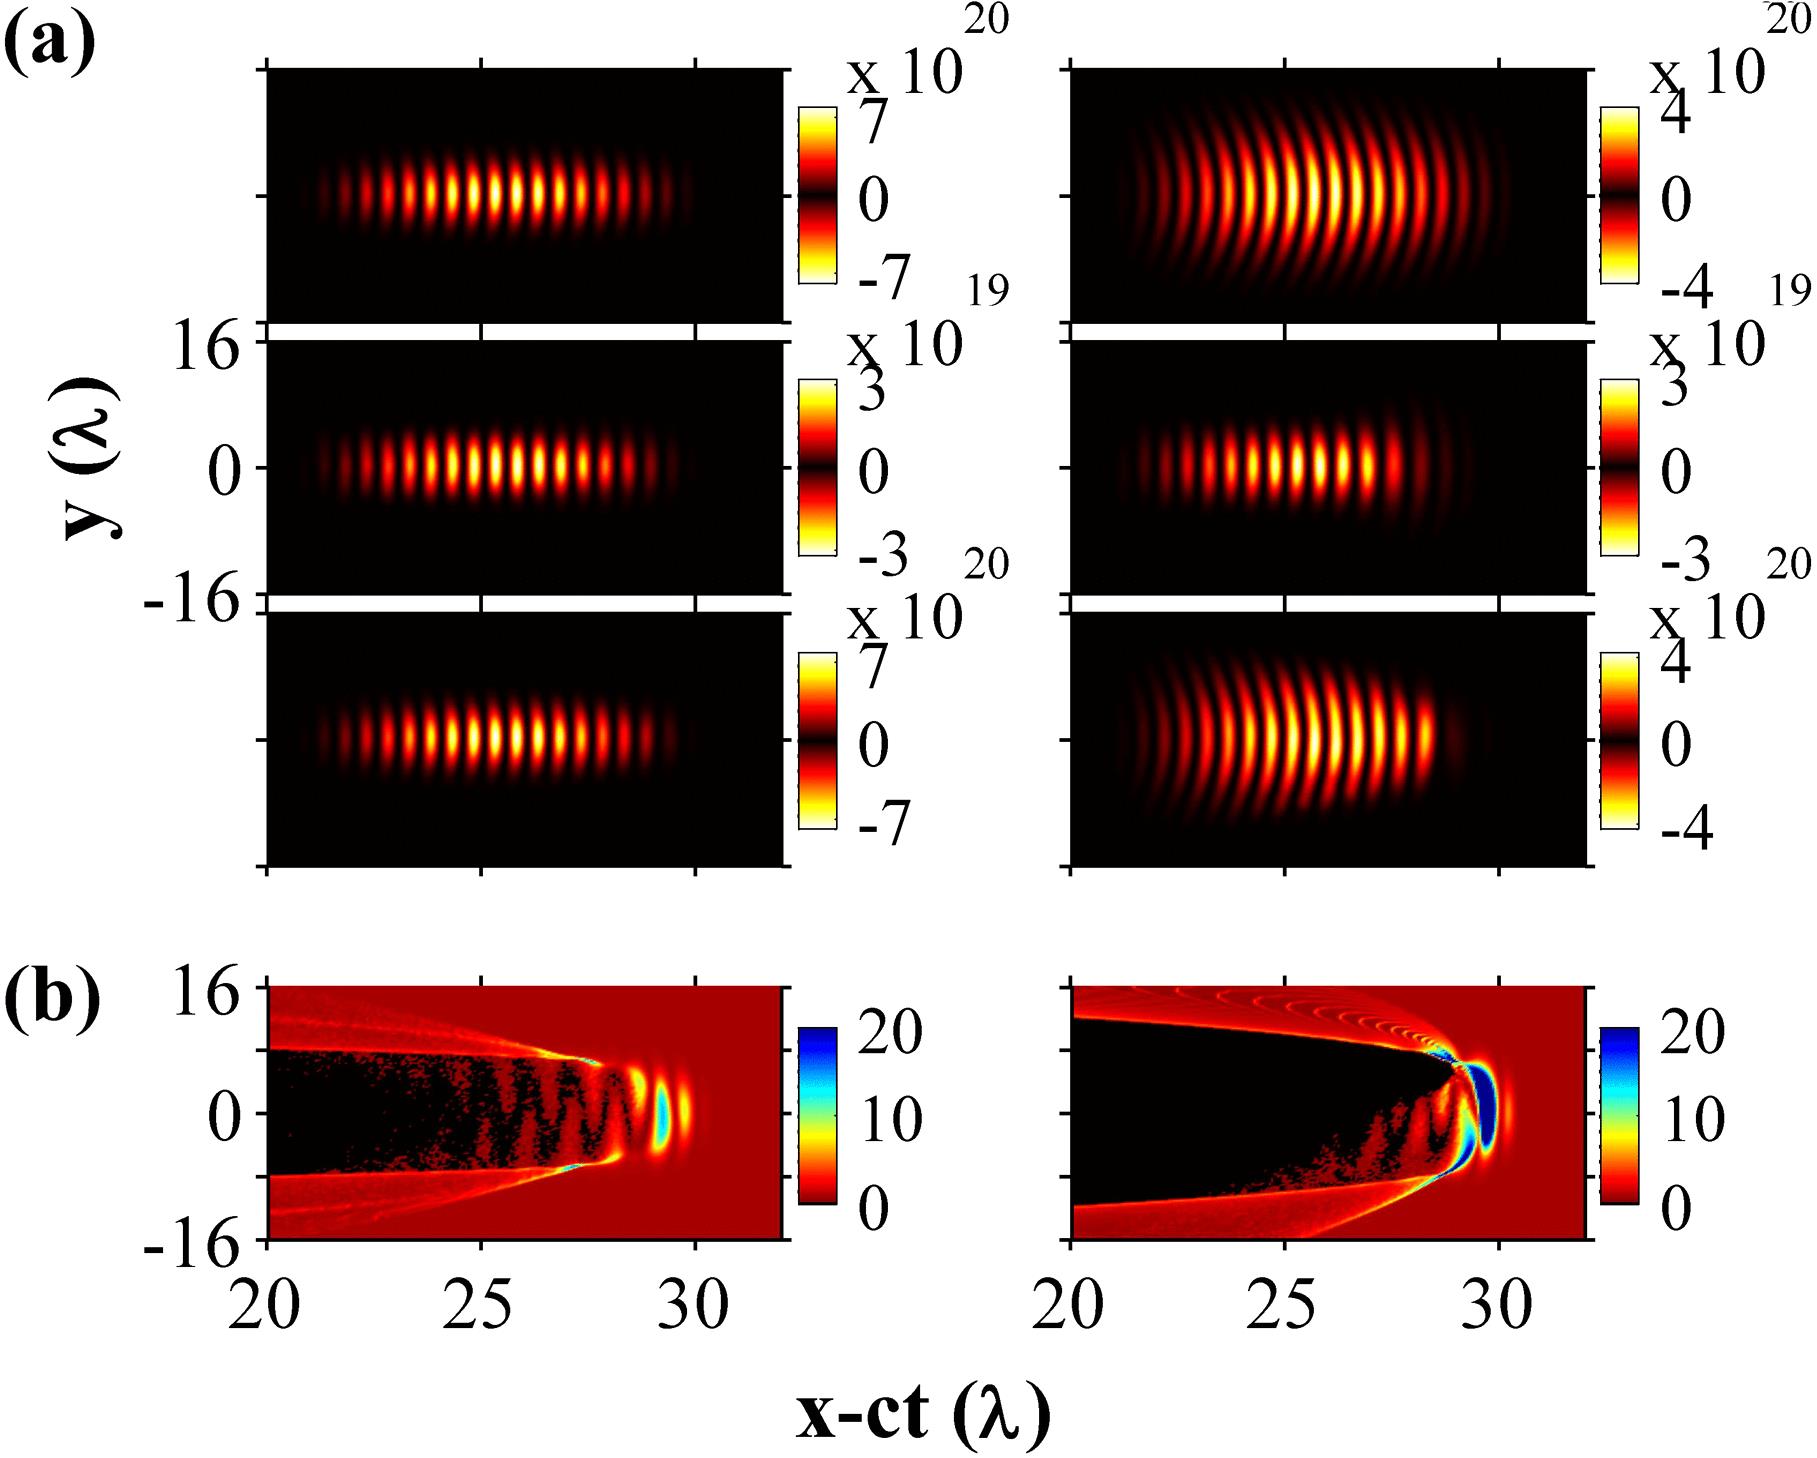
Fig. 1. (a) Spacial distributions of the laser intensities with  . The first and second columns are the results when the lasers propagate for the distances of 0.5 and 2
  , respectively. The first row shows that the laser of 219 TW propagates in the vacuum. The second and third rows show the propagation of the laser pulses with powers of
  (8.8 TW) and
  (219 TW), respectively, in the plasma with density
  . (b) Spacial distributions of the electron densities normalized by
  after the propagation of 0.5
  , where the initial electron densities are taken as
  and laser pulses with powers of
  and
and  are taken in the first and second columns.
. The first and second columns are the results when the lasers propagate for the distances of 0.5 and 2 , respectively. The first row shows that the laser of 219 TW propagates in the vacuum. The second and third rows show the propagation of the laser pulses with powers of (8.8 TW) and (219 TW), respectively, in the plasma with density . (b) Spacial distributions of the electron densities normalized by after the propagation of 0.5 , where the initial electron densities are taken as and laser pulses with powers of and are taken in the first and second columns. 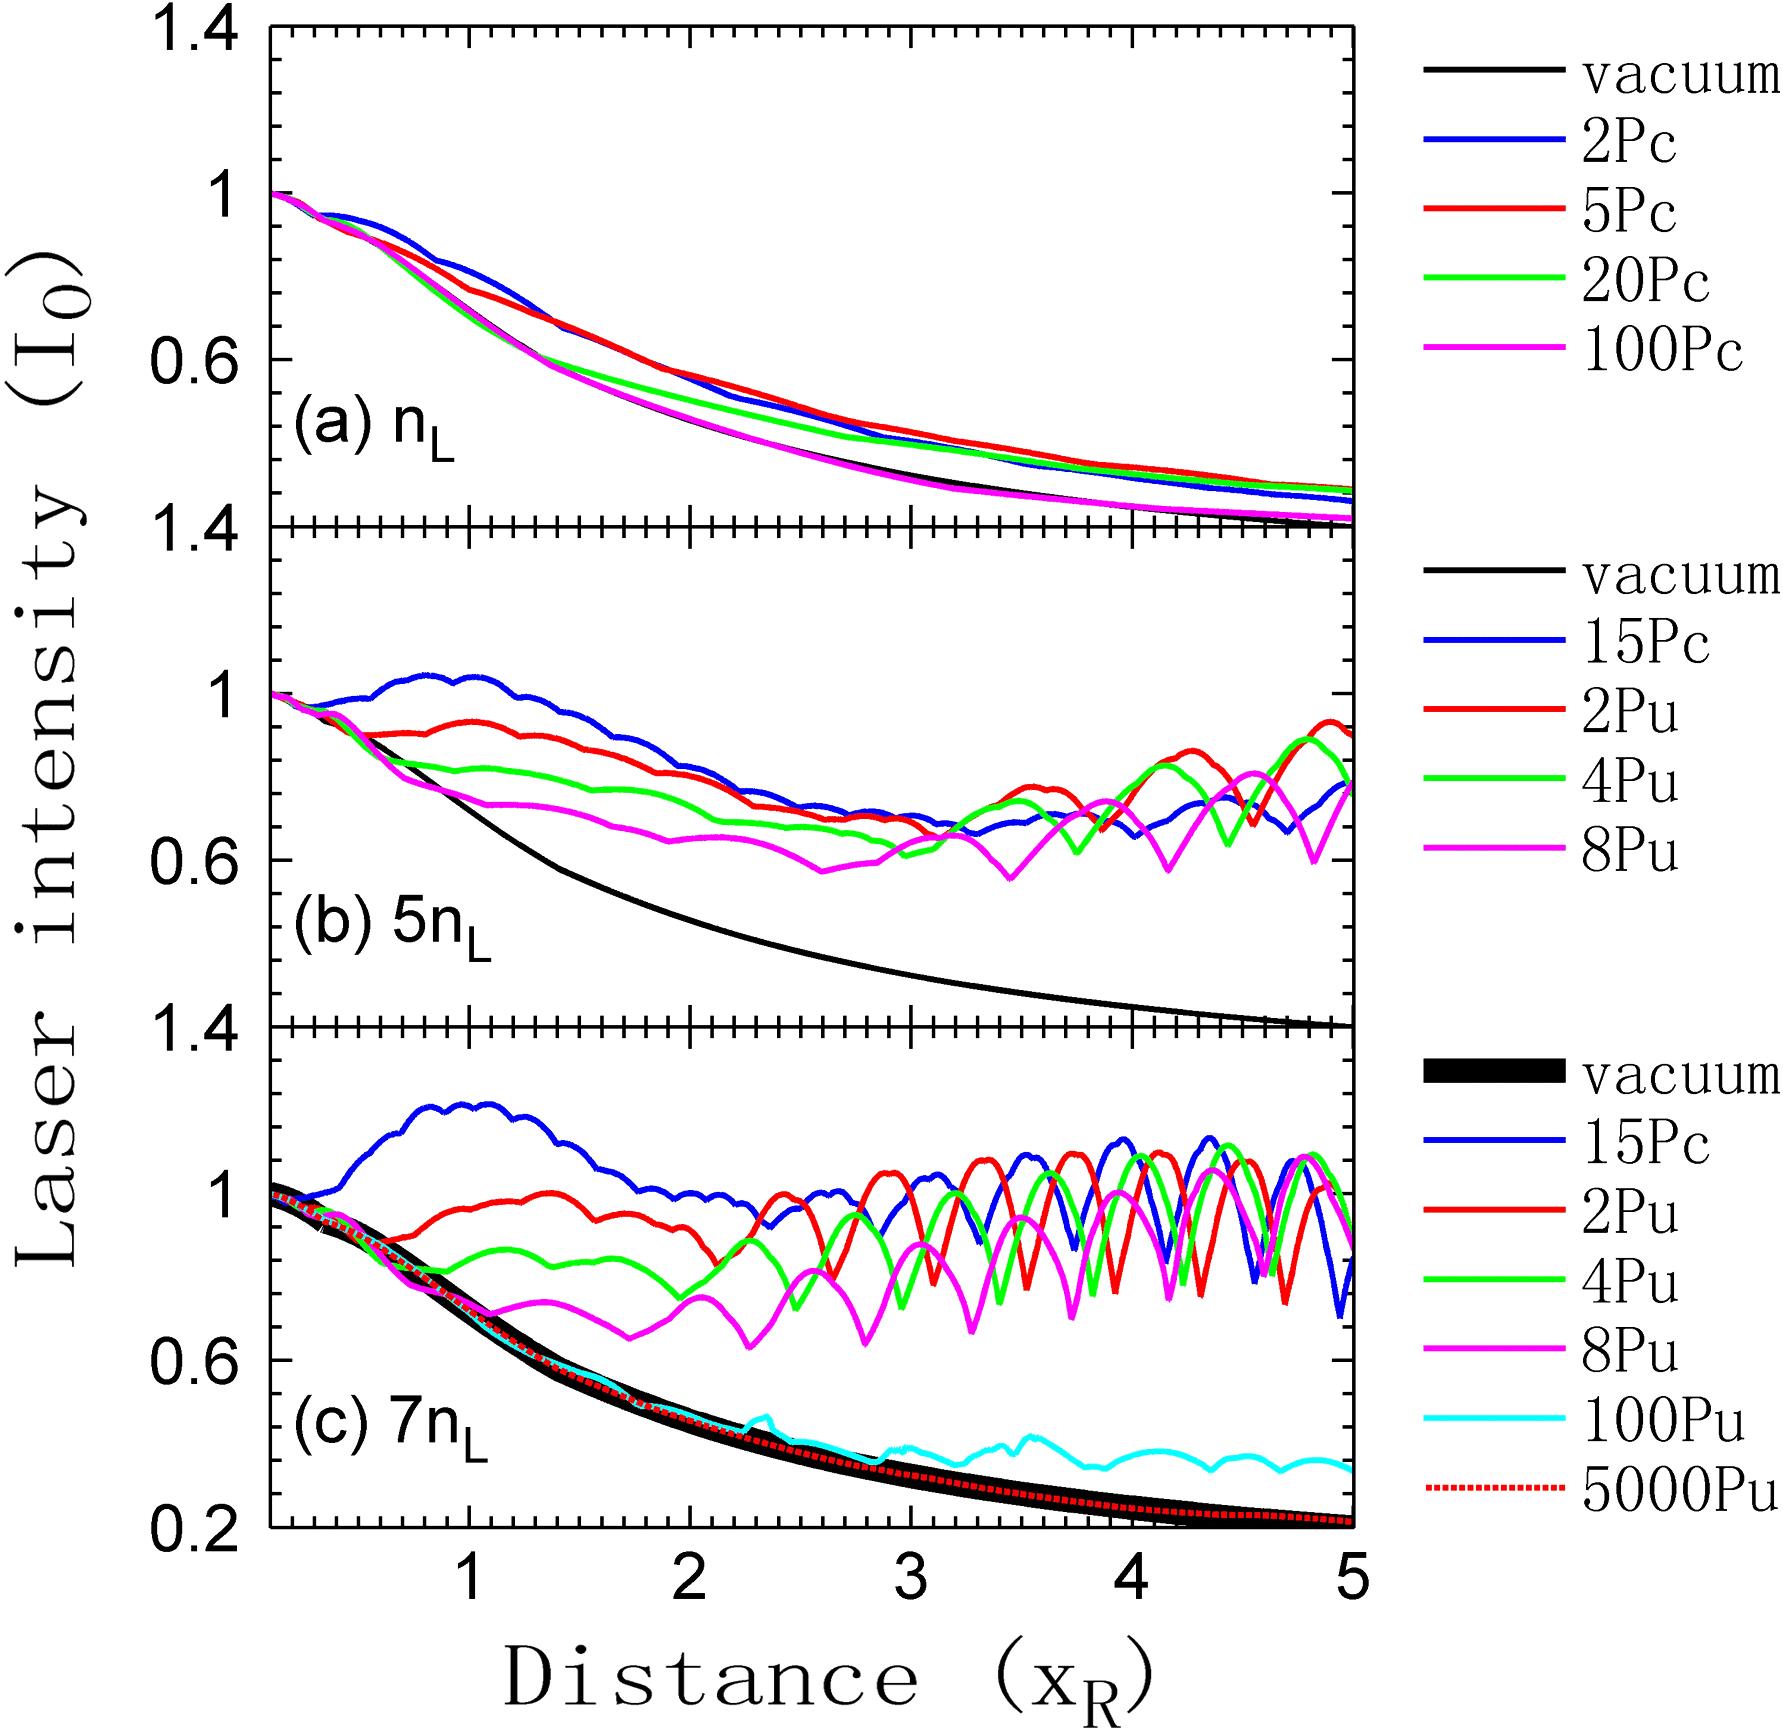
Fig. 2. Evolution of the laser peak intensity with the propagation distance. Plasma densities of 1, 5 and 7  are taken in (a)–(c), respectively. In every picture, the black curve corresponds to a laser propagating in the vacuum, and the other curves correspond to the lasers with different initial powers
  in plasmas. The laser spot radius is fixed as 8
  .
.
are taken in (a)–(c), respectively. In every picture, the black curve corresponds to a laser propagating in the vacuum, and the other curves correspond to the lasers with different initial powers in plasmas. The laser spot radius is fixed as 8 . Fig. 3. Evolution of the laser peak intensity with the propagation distance. Plasma densities of 1, 5 and 7  are taken in (a)–(c), respectively. In every picture, the black curve corresponds to a laser propagating in the vacuum and the other curves correspond to lasers with different initial powers
  in plasmas. The laser spot radius is fixed as 4
  .
.
are taken in (a)–(c), respectively. In every picture, the black curve corresponds to a laser propagating in the vacuum and the other curves correspond to lasers with different initial powers in plasmas. The laser spot radius is fixed as 4 . Fig. 4. Evolution of the laser peak intensity with the propagation distance. Plasma densities of 1, 6 and 12  are taken in (a)–(c), respectively. In every picture, the black curve corresponds to a laser propagating in the vacuum and the other curves correspond to the lasers with different initial powers
  in plasmas. The laser spot radius is fixed as 16
  .
.
are taken in (a)–(c), respectively. In every picture, the black curve corresponds to a laser propagating in the vacuum and the other curves correspond to the lasers with different initial powers in plasmas. The laser spot radius is fixed as 16 . Fig. 5. Evolution of the laser peak intensity with the propagation distance. Laser spot radiuses of 4, 8 and 16  are taken in (a)–(c), respectively. In every picture, the black curve corresponds to a laser propagating in the vacuum and the other curves correspond to lasers in the plasmas with different densities. The initial laser intensity is fixed as
  .
.
are taken in (a)–(c), respectively. In every picture, the black curve corresponds to a laser propagating in the vacuum and the other curves correspond to lasers in the plasmas with different densities. The initial laser intensity is fixed as . Fig. 6. Evolution of the laser peak intensity with the propagation distance. Laser spot radiuses of 8, 16 and 32  are taken in (a)–(c), respectively. In every picture, the black curve corresponds to a laser propagating in the vacuum and the other curves correspond to lasers in the plasmas with different densities. The initial laser intensity is fixed as
  .
.
are taken in (a)–(c), respectively. In every picture, the black curve corresponds to a laser propagating in the vacuum and the other curves correspond to lasers in the plasmas with different densities. The initial laser intensity is fixed as . 

Set citation alerts for the article
Please enter your email address

© Copyright 2018-2021 | Chinese Laser Press. All Rights Reserved 沪ICP备15018463号-20