
Ruoqin Yan, Tao Wang, Xinzhao Yue, Huimin Wang, Yu-Hui Zhang, Peng Xu, Lu Wang, Yuandong Wang, Jinyan Zhang, "Highly sensitive plasmonic nanorod hyperbolic metamaterial biosensor," Photonics Res. 10, 84 (2022)
- Photonics Research
- Vol. 10, Issue 1, 84 (2022)
Abstract
1. INTRODUCTION
Plasmonic nanostructure sensors allow fast, real-time, and free-label detection of molecular interactions, which is particularly valuable for disease diagnosis and biological analysis [1–6]. The basic principle of surface plasmon generation is that when the wavevector of the incident polarized light satisfies the phase-matching condition, it can cause collective oscillations of free electrons at the interface between the noble metal and the dielectric. The evanescent field produced by these oscillations is extremely sensitive to the changes in the refractive index of a dielectric medium. When biomolecules are adsorbed on the surface of the sensor, the refractive index of the evanescent field region can change, causing the resonance wavelength to shift. Therefore, by recording the position of the resonance wavelength, the binding events of biomolecules can be monitored in real time.
Propagating surface plasmon resonance (PSPR) and localized surface plasmon resonance (LSPR) are two classes of conventional plasmonic sensors [7]. PSPR sensors based on gold film are usually built in a Kretschmann configuration to satisfy the condition of momentum matching, whereas LSPR sensors have a tunable resonant wavelength that is determined by the shape, size, and arrangement of the nanoparticles. The sensitivity in the bulk solution is defined as “bulk sensitivity.” A sensor with high bulk sensitivity could be very suitable for detecting bacteria (0.5–5.0 µm) and even cells. The sensitivity at the nanometric vicinity of the sensor is defined as “surface sensitivity.” The surface sensitivity plays a major role in detecting the binding events of biomoleculars [8,9]. Benefiting from the long penetration depth (approximately 200 nm) of the evanescent field in the dielectric, the bulk refractive index sensitivity of the PSPR sensor can reach tens of thousands of nm/RIU in the near-infrared (NIR) region. However, PSPR sensors still require improvement in surface sensitivity for the detection of biomolecule binding owing to the low electric field enhancement effect [10,11]. Moreover, new nanoscale designs and promising manipulation at the nanoscale level are desired to meet modern biotechnology requirements. Compared with PSPR sensors, LSPR sensors have one to two orders of magnitude of a lower sensing response to a bulk refractive index change with a probe depth of 5–15 nm, which is more suitable for detecting surface biomolecule binding [12]. LSPR sensors based on metallic nanoparticles, their low uniformity, and irreproducibility limit their biosensing applications because the particle sizes, shapes, and spatial distribution are difficult to precisely control [13].
Recent advances in nanomanufacturing technology have promoted the development of novel and high-quality plasmonic nanostructures for biosensing, particularly metamaterials, which have the potential to overcome the limitations of conventional plasmonic biosensors [14–18]. Metamaterials are a class of artificial materials that exhibit exotic electromagnetic properties that are not available in natural materials, making them attractive for applications in biosensing. In particular, hyperbolic metamaterials (HMMs) with hyperbolic dispersion have shown extreme sensitivity for refractive index sensing and have become one of the research focuses of plasmonic biosensors [19–24]. The resonance mode of HMMs generally has a high quality factor and exhibits a localized and enhanced evanescent field, which can significantly improve the resolution and sensitivity of sensors.
Sign up for Photonics Research TOC. Get the latest issue of Photonics Research delivered right to you!Sign up now
In this study, we described the fabrication, the characterization, and the principle of operation of gold nanorod hyperbolic metamaterials (NHMMs) along with ultrasensitive bulk refractive index and label-free biomolecular detection. By combining electron-beam lithography (EBL) and electroplating, we demonstrated the fabrication of a highly ordered, height-controllable, and vertical array of nanorods. By exciting the bulk plasmon–polariton mode in the NHMM using a prism-coupling technique and integrating the sensor in microfluidics, we demonstrated that the bulk sensitivity and figure of merit (FOM) of our device can reach 41,600 nm/RIU and 416 RIU-1, respectively, which are both outstanding compared to those of many advanced plasmonic sensors. Simulations and experiments were performed to better understand the mechanism of such high bulk sensitivity. Furthermore, by bio-functionalizing the surface of the NHMM sensor, monitoring the binding of streptavidin at dilute concentrations was performed in real time. We tested different concentrations of streptavidin ranging from 200 to 5 µg/mL, and the NHMM biosensor exhibited a 1 nm wavelength shift for a 5 µg/mL streptavidin detection. By fitting the Hill equation of the NHMM biosensor and taking into account the level of noise (0.05 nm) as the minimum wavelength shift of the detectable limit, the limit of detection (LOD) of the NHMM biosensor to streptavidin can be estimated to be 0.14 µg/mL (2.4 nm). Under identical experimental conditions, a 0.5 nm wavelength shift for 20 µg/mL streptavidin was reported when using a conventional gold film sensor. Finally, we demonstrated a simple and effective way to remove the self-assembled layer on the sensor surface using sodium borohydride.
2. RESULTS AND DISCUSSION
A. Fabrication and Characterization of the NHMM Sensor
The NHMM refractometric sensor was fabricated by combining EBL and electroplating. A highly ordered periodic hole array can be obtained by EBL, whereas the electrochemical method can grow highly-perpendicular nanorod arrays from bottom to top at a low cost. Figure 1(a) shows a schematic of the microfluidic-integrated NHMM biosensor. The NHMM sensor was built using the Kretschmann configuration. Figure 1(b) shows a photograph of the NHMM sensor fully integrated with a microfluidic channel and sample tubing. The fabrication process is shown in Fig. 2. First, a Cr (5 nm)/Au (22 nm) seed layer was deposited on a glass substrate by using electron-beam evaporation (EBE). Then, the EBL process was implemented to transfer the pattern of highly ordered holes to the polymethylmethacrylate (PMMA) coated on the metal layer. Subsequently, the electroplating of Au was carried out with the nano-patterned PMMA as a template, followed by the removal of PMMA using acetone. Scanning electron microscopy (SEM) images of the fabricated devices are shown in Fig. 3. In the electrochemical process, an electric quantity control method is used for electroplating. Under the appropriate temperature and current, the height of the nanorods can be adjusted by varying the amount of electricity. It is worth mentioning that although the height of the array can be well controlled by using EBE deposition, owing to the closure effect, the frustum of a cone rather than cylinders is actually grown[25]. In addition, owing to the difficulty of metal lift-off and the high cost of the EBE method when depositing gold nanorods hundreds of nanometers high, the electrochemical method is a more ideal choice. Figures 3(a) and 3(b) show the samples with suitable electroplating and over-electroplating, respectively. When the electric quantity is appropriate, the nanorods grow to the expected height, which is in a suitable electroplating state. When the electric quantity is set too high, the nanorods overflow from the hole of the PMMA, which is in a over-plating state. Figure 3(c) shows a large-area sample made at suitable electroplating that can be applied to sensing. The measured period and diameter of the nanorods were 210 and 150 nm, respectively. An average height of 350 nm was obtained. Compared with the nanorod array fabricated by combining the anodized aluminum oxide (AAO) template and the electrochemical method mentioned in the previous study [19], the nanorod array fabricated by combining EBL and the electrochemical method is more regular and orderly, which aids in the release of the sensing performance of the NHMM sensor. Once the feasibility of the device is verified, the EBL can be replaced by a nanoimprint template, allowing the possibility for large-scale and low-cost production [26].
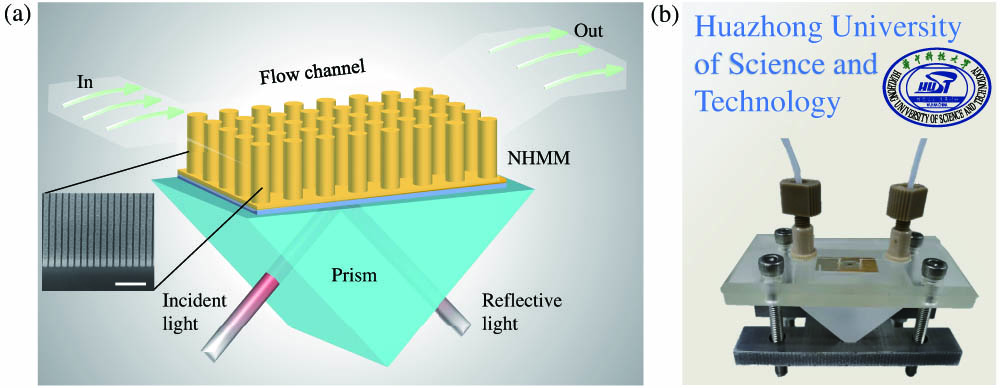
Figure 1.NHMM sensor integrated with microfluidics. (a) Schematic diagram of the NHMM sensor with a liquid flow channel and an SEM image of the fabricated nanorod array with a consistent period of 210 nm, diameter of 150 nm, and average height of 350 nm (scale bar, 1 µm). (b) Photo of the NHMM sensor and a prism integrated with a microfluidics system.
![]()
Figure 2.Schematic diagram of the process of fabricating the NHMM.
![]()
Figure 3.SEM images of the fabricated gold nanorod array by combining EBL and electroplating. (a) The electric quantity is appropriate, and the nanorods reach the expected height. (b) Over electroplating: the electric quantity is too large and the nanorods overflow. (c) Large-area sample grown under a suitable electric quantity. All pictures were taken at a depression angle of 45°.
B. Bulk Plasmon–Polaritons (BPPs) in NHMM
The manufactured NHMM exhibits anisotropic optical properties, which can be described using the effective medium theory (EMT). The permittivity perpendicular to the nanorods (
The penetration depth,
C. Bulk Sensitivity and Optical Properties
Next, we revealed the optical properties and ultrahigh bulk sensitivity of the sensor through simulations and experiments. The finite element method (FEM), implemented through 3D simulations using COMSOL 5.5, was adopted to simulate the reflection spectrum and the electric field distribution at the resonance wavelength. In our simulations, a free tetrahedral mesh was used for the entire region. A moderate mesh grid was adopted for an effective tradeoff among accuracy, memory requirements, and simulation time. The horizontal and vertical directions were adopted for the Floquet periodic boundary condition and perfect matching layer condition, respectively. The permittivity of gold was taken from Palik [31], and the refractive index of the prism was set to 1.5163.
The resonance responses of the NHMM structure with different height and filling factor were investigated. As shown in Fig. 4(a), an approximately equal interval increase in the resonance wavelength from 1109 nm to 1386 nm as the height increases from 300 nm to 390 nm can be observed. In addition, there is a slight increase in the wavelength shift (
![]()
Figure 4.(a) Resonance wavelength and wavelength shift (
![]()
Figure 5.(a) Simulated and (b) experimental reflectance of the plasmonic NHMM sensor in deionized (DI) water and 0.5% glycerin in DI water. The simulation parameters are as follows: the period, height, and radius of the nanorods are 210 nm, 350 nm, and 75 nm, respectively. (c) The curve of the simulated electric field intensity with
The extremely high bulk sensitivity can be attributed to the ultra-long penetration depth of the BPP mode in the NHMM sensor. To further clarify the physical mechanism of the high-sensitivity behaviors in the NHMM sensor, we simulated the electric field distributions at the resonance wavelength corresponding to various incident angles. Figure 5(c) shows the attenuation of the electric field along the surface of the nanorod in the environment. Overall, when the incident angle was close to the critical angle of the total reflection, the penetration depth of the electric field was the longest. The penetration depth of the electric field decreased as the incident angle increased. In addition, the increase in the incident angle did not significantly weaken the electric field within 100 nm of the nanorod surface. We also experimentally revealed the dependence of the bulk sensitivity of the NHMM sensor on the incident angle. We measured the resonant dip position of the reflection spectrum when the DI water and the 0.5% glycerol were injected into the microfluidics at different incident angles and calculated the wavelength shift. As shown in Fig. 5(d), when the incident angle is adjusted close to the critical angle of the total reflection, we obtain the maximum wavelength shift. As the incident angle increases, the wavelength shift exhibits an exponential decay trend, which is consistent with our analysis of the evanescent field. We demonstrated the dependence of the bulk sensitivity on the incident angle using the analysis model, simulation, and experimental results.
The manufacturing error of the NHMM sensor is the main cause of the difference in the resonance wavelength of the simulation and experiment results. In the parameter sweeping we performed, the resonance wavelength of the NHMM sensor was closely related to the height and filling factor of the nanorod. Slight deviations of these parameters can lead to a difference in the resonance wavelength. In addition, there is a slight difference between the permittivity of gold in the experiment and simulation. All these factors together have caused the difference of the resonance wavelength obtained by experiment and simulation.
It should be noted that the FWHM of the resonance dip measured experimentally was much larger than the simulated result. The height of the nanorod significantly affects the position of the resonance wavelength. When the top of the nanorods was rough and uneven, there was an inconsistency in the height of the nanorods, which could cause the resonance dip to broaden. We believe this difference cannot be attributed solely to the manufacturing error of the device but also partly because the incident light in the experiment was not purely parallel light. The resonant wavelength of the BPP mode is angle dependent. Owing to the non-negligible divergence angle of the incident light, the bandwidth of the resonance dip is broadened. Therefore, decreasing the divergence angle of the incident light aids in further improving the FOM of the NHMM sensor.
Moreover, as shown in Fig. 6, there is a clear bulk resonance mode with a significantly enhanced electric field in the NHMM slab that penetrates into the environment, as well as a localized electric field surrounding the top of the nanorod. It is necessary to distinguish the electric field enhancement of the BPP in the NHMM from the electric field enhancement of the LSPR based on nanoparticles. BPP is formed in the NHMM slab, and the electric field decays in the environment, whereas the electric field of the LSPR is generally limited to the top of the nanoparticles without the bulk mode. In the NHMM, the nanorods are wrapped by the sensing substance. Thus, the BPP mode provides a better overlap between the sensed substance and the sensing field than the conventional surface plasmonic sensors. In addition, owing to the modification of the plasmon–plasmon interaction in the nanorod array, the effective permittivity
![]()
Figure 6.Simulation diagram of the electric field at the resonance wavelength.
In addition, as shown in Fig. 3(a), the top of the fabricated nanorods was not smooth but presented a kind of tip. To study the influence of the tip on the top of the nanorod, we did a simulation analysis, adding five gold nanocones on the top of the nanorod. The reflection spectrum of the structure with the nanocones is shown in Fig. 7(a). When compared to the case without the gold cone, the resonance wavelength was slightly red shifted, which was related to the increase in the overall height of the nanorods due to the existence of the gold cones. The cross-sectional electric field diagram at the top of the nanocone is shown in Fig. 7(b), and a local electric field existed at the top of the nanocone, which could play a positive role in biosensing.
![]()
Figure 7.(a) Simulated reflectance of the plasmonic NHMM sensor in DI water and 0.5% glycerin in DI water. The model with the addition of the five gold nanocones to the top of the nanorod to simulate the tips produced in the manufacturing process is shown in the inset. The base and top radii of the nanocones are 15 nm and 1 nm, respectively, and the height of the nanocones is 20 nm. (b) A cross-sectional electric field diagram at the top of the nanocones.
D. Biotin–streptavidin Biosensing
To demonstrate the label-free detection of the interaction of the biomolecules on the surface of the NHMM biosensor, we implemented tests using the biotin–streptavidin affinity model. The interaction of streptavidin and biotin has been developed for application in numerous biomedical and proteomics research. Streptavidin is one of the most commonly used model proteins in biosensing research, and its detection is usually used as the initial proof-of-concept for new biosensor designs.
In the biosensing experiment, the plasmonic NHMM biosensor was bio-functionalized with thiolated biotin and specific immobilization of streptavidin, as shown in Fig. 8(a). Initially, the sensor was functionalized with a 10 mm Biotin-PEG2000-SH solution (in DI water) for over 24 h at 37°C, in which a self-assembled biotin monolayer was formed on the sensor surface. Then, the bio-functionalized NHMM was washed with DI water and integrated into the microfluid after drying. Streptavidin solutions were prepared by diluting them in 10 mm phosphate-buffered saline (PBS).
![]()
Figure 8.(a) Schematic diagram of bio-functionalization on the NHMM biosensor. (b) and (c) Sensorgrams for real-time detection of different concentrations of streptavidin. (d) Wavelength shift as a function of streptavidin concentration, and the error bars represent the standard deviation. The red curve was fitted by the Hill equation. (e) Sensorgrams for detecting 20 µg/mL streptavidin by 50 nm gold film PSPR biosensor.
In the test, we first injected the PBS and recorded the position of the resonance dip. Streptavidin was injected under the assumption that the measurement system was stable, i.e., there was no wavelength shift. During the scan, the flow rate of the microfluidic pump was set to 10 µL/min and the wavelength resolution of the spectrometer to 0.5 nm. Although the minimum resolution of our spectrometer can be as low as 0.2 nm, we found, at experiment, when a high resolution was used, the signal became unstable. There are two reasons for this phenomenon. On the one hand, the performance of the spectrometer will deteriorate at a high resolution. On the other hand, the noise of the measurement system cannot be ignored. At a high resolution, the resonance wavelength jitter caused by the noise is more prominent. Therefore, a 0.5 nm scanning interval was chosen in our biosensing experiment. After the spectrometer continuously scanned all the spectra, the resonance wavelength of each reflection spectrum, i.e., the wavelength corresponding to the lowest reflectance, was extracted by a python program.
The response of the biosensor during the detection of the different concentrations of streptavidin ranging from 200 to 5 µg/mL is shown in Figs. 8(b) and 8(c). First, the PBS was injected into the microchannel to determine the spectral baseline. Because no molecular binding event occurred during this process, the position of the resonance dip remained unchanged. The streptavidin was then injected, and the resonance wavelength was recorded over a reaction time of 50 min. The interaction process was related to the concentration of the streptavidin, the number of biotin sites, the flow rate, the size of the microfluidic, and even the nanostructure of the sensor. The biotin sites on the NHMM biosensor surface were excessive, and the streptavidin in the solution was a small amount. The more streptavidin was bound, the greater the steric hindrance, and the subsequent binding could be more difficult. Increasing the flow rate may shorten the time to saturation.
In the research [22], the combination of biotin and streptavidin takes about 40 min. In other research [33], the combination of streptavidin and biotin takes about 2 h. Therefore, it was normal to take nearly 50 min to reach saturation in our experiment. In the initial region, the binding of streptavidin and biotin caused a significant red shift in the resonance dip, which was proportional to the concentration of streptavidin. Over time, the biotin sites were gradually occupied by the streptavidin, leading to the saturation of the wavelength shift. Finally, the PBS was again injected into the microchannel, and no blue shift of the resonance dip was observed. This is because the combination of biotin and streptavidin is forceful, and the red shift is caused by the combination of biotin and streptavidin rather than the difference in the refractive index of the bulk solutions. The results of the refractometer also showed that the differences in the refractive index between these streptavidin solutions and the PBS were less than
To verify the reliability and repeatability of the sensing substrate, each concentration of the streptavidin solution was measured three times. Figure 8(d) shows that the standard variance of the repeated results is small, indicating that our NHMM biosensor had good repeatability for the detection of streptavidin. The NHMM biosensor exhibited a 1 nm wavelength shift for a 5 µg/mL streptavidin detection. As a direct comparison, as shown in Fig. 8(e), we prepared a 50 nm gold film PSPR biosensor that exhibited a 0.5 nm wavelength shift for a 20 µg/mL streptavidin detection under identical experimental conditions and for the same resonance wavelength. These results demonstrate that free-label biosensing based on the NHMM biosensor is a highly competitive technique when compared to the conventional gold film PSPR sensor. This indicates that the NHMM biosensor has a high surface sensitivity. Furthermore, Svedendahl et al. demonstrated that LSPR and PSPR biosensors exhibited very similar sensing performance in terms of the signal-to-noise ratio and the wavelength shifts for the biotin-avidin coupling experiments [34]. Therefore, the NHMM biosensor has a high performance for biomolecular detection based on specific binding, which is promising for biomedical applications. In addition, we tested 20 µg/mL of streptavidin by increasing the incident angle from the critical angle, and we observed that there was no significant difference in the wavelength red shift. This can be explained as follows: unlike the case increasing the incident angle where the electric field penetration depth is significantly reduced, increasing the incident angle causes the surface electric field to change less drastically. Thus, there is no clear difference in the performance of the free-label detection under different incident angles.
We have conducted an experiment to prove that the wavelength shift came from the specific binding of streptavidin and biotin. The experimental results are shown in Fig. 9. First, the PBS was injected into the microchannel to obtain a stable baseline, and then 50 µg/mL of bovine serum albumin (BSA) was injected. Within the scanning time of approximately 20 min, no wavelength shift was observed, i.e., no molecular binding events occurred. Then, 50 µg/mL of streptavidin was injected, and the resonance wavelength shifted rapidly, reaching saturation after 50 min. The molecular weight of the BSA is 66 kDa, and detecting the BSA could not be more difficult than detecting the streptavidin (58 kDa). No wavelength shift observed at such a concentration indicated that the BSA did not bind on the sensor surface. The results of the refractometer showed that the refractive indices of the PBS, the 50 µg/mL BSA, and the streptavidin were the same. Thus, the change of the solution did not cause the wavelength shift. Therefore, we can conclude that the wavelength shift was due to the specific binding of the streptavidin and the biotin.
![]()
Figure 9.Variation of the wavelength shift in the presence of the PBS, the 50 µg/mL BSA, and the streptavidin over time.
An essential merit of the NHMM biosensor is its discontinuous nanotexture, which makes it possible to implement new sensing geometries and strategies, whereas conventional gold film PSPR sensors are not feasible. The significantly enlarged adsorption surface provided by the NHMM considerably increased the amount of biomolecules incorporated into the nanoarray within the accessible detection region, maximizing the surface sensitivity of the NHMM biosensor. Moreover, the spacing between the nanorods can be user-defined to match the size of the biological analytes of interest, thereby further obtaining size-selective options that are significant for numerous tasks in immunoassays and protein and virus detection [35].
Moreover, the adsorption process of streptavidin on the surface of the plasmonic NHMM biosensor can be modeled using the Hill equation. That is, the wavelength shift
A key step in ensuring the reproducibility of the biosening experiments is the effective removal of the biological layer after the test so that it can be re-modified for the new concentration test. In our experiment, we referred to the method of removing self-assembled monolayers (SAMs) on gold proposed by Yuan et al. [37]. We verified that the SAM of the thiolates on the NHMM biosensor can be removed (the bond cleavage of S-Au) efficiently by immersing 1 mol/L
Results of the Energy Dispersive Spectrometer (EDS)
| Element | C | N | O | Na | Si | S | K | Au | Total | |
|---|---|---|---|---|---|---|---|---|---|---|
| Weight percentage (%) | 8.54 | 2.46 | 25.87 | 4.43 | 31.63 | 0.53 | 9.09 | 17.44 | 100 | |
| Weight percentage (%) | 4.62 | 0.98 | 27.57 | 5.07 | 35.08 | 0 | 10.36 | 16.33 | 100 |
3. CONCLUSION
In conclusion, we described the fabrication, the characterization, and the principle of operation of nanorod hyperbolic metamaterials (NHMMs) along with ultrasensitive bulk refractive index and label-free biomolecular detection. A high-uniformity NHMM sensor was fabricated by combining electron-beam exposure and electroplating for high-performance plasmonic sensing, demonstrating an extremely high bulk refractive index sensitivity of 41,600 nm/RIU and a figure of merit of 416 RIU-1. We have revealed the bulk sensitivity dependence of the incident angle through simulations and experiments. Furthermore, the NHMM biosensor was bio-functionalized to further demonstrate its potential as a universal biosensor by real-time monitoring of the resonance dip shifts upon the biotin/streptavidin interaction. We tested different concentrations of streptavidin ranging from 200 to 5 µg/mL, and the NHMM biosensor exhibited a 1 nm wavelength shift for a 5 µg/mL streptavidin detection. By fitting the Hill equation of the NHMM biosensor and taking into account the level of noise (0.05 nm) as the minimum wavelength shift of the detectable limit, the limit of detection of the NHMM biosensor to streptavidin can be estimated to be 0.14 µg/mL (2.4 nm). As a direct comparison, a 0.5 nm wavelength shift for 20 µg/mL streptavidin was reported when using a conventional gold film sensor under identical experimental conditions. Our study indicates that the plasmonic NHMM biosensor has widespread applications in label-free biomedical and chemical studies.
Acknowledgment
Acknowledgment. The authors would like to thank Ms. Wei Zhang of the College of Life Science and Technology (HUST) for his helpful discussions. They also thank Cheng Zeng, engineer in the Center of Optoelectronic Micro & Nano Fabrication and Characterizing Facility of WNLO, for the support in EBL.
APPENDIX A
When using the prism-coupling approach, the transverse wavevector of the incident TM light after passing through the prism is
![]()
Figure 10.Schematic diagram showing the setup used for reflectivity measurements.
![]()
Figure 11.Schematic diagram of the cross-section of the microfluidic system.
In our experiment, the noise mainly came from the following aspects, including the stability of the light source, the alignment of the optical path system, the microfluidics, the environmental temperature, and so on. All these aspects can cause spectral jitter, which in turn affects the position of the resonance wavelength. We assessed the effect of the noise on the resonance wavelength by the following method. When the scanning interval was set to 0.5 nm, in the PBS, the resonance wavelength was stable within 60 min, indicating that the wavelength shift caused by the noise was less than 0.5 nm. Therefore, it can be considered that the experimental overall noise was less than 0.5 nm. Before starting a biosensing experiment, an indispensable task is to control the noise level below 0.5 nm.
References
[1] J. R. Mejía-Salazar, O. N. Oliveira. Plasmonic biosensing: focus review. Chem. Rev., 118, 10617-10625(2018).
[2] B. Špačková, P. Wrobel, M. Bocková, J. Homola. Optical biosensors based on plasmonic nanostructures: a review. Proc. IEEE, 104, 2380-2408(2016).
[3] S. Sugumaran, M. F. Jamlos, M. N. Ahmad, C. S. Bellan, D. Schreurs. Nanostructured materials with plasmonic nanobiosensors for early cancer detection: a past and future prospect. Biosens. Bioelectron., 100, 361-373(2018).
[4] R. Yan, T. Wang, X. Jiang, Q. Zhong, X. Huang, L. Wang, X. Yue. Design of high-performance plasmonic nanosensors by particle swarm optimization algorithm combined with machine learning. Nanotechnology, 31, 375202(2020).
[5] M. Gao, W. Yang, Z. Wang, S. Lin, J. Zhu, Z. Yang. Plasmonic resonance-linewidth shrinkage to boost biosensing. Photon. Res., 8, 1226-1235(2020).
[6] F. Arcadio, L. Zeni, D. Montemurro, C. Eramo, S. D. Ronza, C. Perri, G. D’Agostino, G. Chiaretti, G. Porto, N. Cennamo. Biochemical sensing exploiting plasmonic sensors based on gold nanogratings and polymer optical fibers. Photon. Res., 9, 1397-1408(2021).
[7] Y. Xu, P. Bai, X. Zhou, Y. Akimov, C. E. Png, L.-K. Ang, W. Knoll, L. Wu. Optical refractive index sensors with plasmonic and photonic structures: promising and inconvenient truth. Adv. Opt. Mater., 7, 1801433(2019).
[8] A. Abbas, M. J. Linman, Q. Cheng. Sensitivity comparison of surface plasmon resonance and plasmon-waveguide resonance biosensors. Sens. Actuators B, 156, 169-175(2011).
[9] R. Rizzo, N. Danz, F. Michelotti, E. Maillart, A. Anopchenko, C. Wächter. Optimization of angularly resolved Bloch surface wave biosensors. Opt. Express, 22, 23202-23214(2014).
[10] A. Shalabney, I. Abdulhalim. Sensitivity-enhancement methods for surface plasmon sensors. Laser Photon. Rev., 5, 571-606(2011).
[11] S. Zeng, K. V. Sreekanth, J. Shang, T. Yu, C.-K. Chen, F. Yin, D. Baillargeat, P. Coquet, H.-P. Ho, A. V. Kabashin, K.-T. Yong. Graphene–gold metasurface architectures for ultrasensitive plasmonic biosensing. Adv. Mater., 27, 6163-6169(2015).
[12] K. M. Mayer, J. H. Hafner. Localized surface plasmon resonance sensors. Chem. Rev., 111, 3828-3857(2011).
[13] J. Jiang, X. Wang, S. Li, F. Ding, N. Li, S. Meng, R. Li, J. Qi, Q. Liu, G. L. Liu. Plasmonic nano-arrays for ultrasensitive bio-sensing. Nanophotonics, 7, 1517-1531(2018).
[14] T. Chen, S. Li, H. Sun. Metamaterials application in sensing. Sensors, 12, 2742-2765(2012).
[15] Y. Lee, S.-J. Kim, H. Park, B. Lee. Metamaterials and metasurfaces for sensor applications. Sensors, 17, 1726(2017).
[16] W. Wang, F. Yan, S. Tan, H. Zhou, Y. Hou. Ultrasensitive terahertz metamaterial sensor based on vertical split ring resonators. Photon. Res., 5, 571-577(2017).
[17] M. M. Hassan, F. S. Sium, F. Islam, S. M. Choudhury. A review on plasmonic and metamaterial based biosensing platforms for virus detection. Sens. Bio-Sens. Res., 33, 100429(2021).
[18] H. M. Silalahi, Y.-P. Chen, Y.-H. Shih, Y.-S. Chen, X.-Y. Lin, J.-H. Liu, C.-Y. Huang. Floating terahertz metamaterials with extremely large refractive index sensitivities. Photon. Res., 9, 1970-1978(2021).
[19] A. V. Kabashin, P. Evans, S. Pastkovsky, W. Hendren, G. A. Wurtz, R. Atkinson, R. Pollard, V. Podolskiy, A. V. Zayats. Plasmonic nanorod metamaterials for biosensing. Nat. Mater., 8, 867-871(2009).
[20] N. Vasilantonakis, G. A. Wurtz, V. Podolskiy, A. Zayats. Refractive index sensing with hyperbolic metamaterials: strategies for biosensing and nonlinearity enhancement. Opt. Express, 23, 14329-14343(2015).
[21] K. V. Sreekanth, Y. Alapan, M. ElKabbash, A. M. Wen, E. Ilker, M. Hinczewski, U. A. Gurkan, N. F. Steinmetz, G. Strangi. Enhancing the angular sensitivity of plasmonic sensors using hyperbolic metamaterials. Adv. Opt. Mater., 4, 1767-1772(2016).
[22] K. V. Sreekanth, Y. Alapan, M. ElKabbash, E. Ilker, M. Hinczewski, U. A. Gurkan, A. De Luca, G. Strangi. Extreme sensitivity biosensing platform based on hyperbolic metamaterials. Nat. Mater., 15, 621-627(2016).
[23] K. V. Sreekanth, Q. Ouyang, S. Sreejith, S. Zeng, W. Lishu, E. Ilker, W. Dong, M. ElKabbash, Y. Ting, C. T. Lim, M. Hinczewski, G. Strangi, K.-T. Yong, R. E. Simpson, R. Singh. Phase-change-material-based low-loss visible-frequency hyperbolic metamaterials for ultrasensitive label-free biosensing. Adv. Opt. Mater., 7, 1900081(2019).
[24] C. Li, J. Gao, M. Shafi, R. Liu, Z. Zha, D. Feng, M. Liu, X. Du, W. Yue, S. Jiang. Optical fiber SPR biosensor complying with a 3D composite hyperbolic metamaterial and a graphene film. Photon. Res., 9, 379-388(2021).
[25] Y. Lei, W.-K. Chim. Shape and size control of regularly arrayed nanodots fabricated using ultrathin alumina masks. Chem. Mater., 17, 580-585(2005).
[26] L. Gao, K. Shigeta, A. Vazquez-Guardado, C. J. Progler, G. R. Bogart, J. A. Rogers, D. Chanda. Nanoimprinting techniques for large-area three-dimensional negative index metamaterials with operation in the visible and telecom bands. ACS Nano, 8, 5535-5542(2014).
[27] J. Elser, R. Wangberg, V. A. Podolskiy, E. E. Narimanov. Nanowire metamaterials with extreme optical anisotropy. Appl. Phys. Lett., 89, 261102(2006).
[28] N. Vasilantonakis, M. E. Nasir, W. Dickson, G. A. Wurtz, A. V. Zayats. Bulk plasmon-polaritons in hyperbolic nanorod metamaterial waveguides. Laser Photon. Rev., 9, 345-353(2015).
[29] W. Dickson, S. Beckett, C. McClatchey, A. Murphy, D. O’Connor, G. A. Wurtz, R. Pollard, A. V. Zayats. Hyperbolic polaritonic crystals based on nanostructured nanorod metamaterials. Adv. Mater., 27, 5974-5980(2015).
[30] A. Shalabney, I. Abdulhalim. Electromagnetic fields distribution in multilayer thin film structures and the origin of sensitivity enhancement in surface plasmon resonance sensors. Sens. Actuators A, 159, 24-32(2010).
[31] E. D. Palik. Handbook of Optical Constants of Solids, 3(1998).
[32] J. N. Anker, W. P. Hall, O. Lyandres, N. C. Shah, J. Zhao, R. P. Van Duyne. Biosensing with plasmonic nanosensors. Nat. Mater., 7, 442-453(2008).
[33] A. Ameen, L. P. Hackett, S. Seo, F. K. Dar, M. R. Gartia, L. L. Goddard, G. L. Liu. Plasmonic sensing of oncoproteins without resonance shift using 3D periodic nanocavity in nanocup arrays. Adv. Opt. Mater., 5, 1601051(2017).
[34] M. Svedendahl, S. Chen, A. Dmitriev, M. Käll. Refractometric sensing using propagating versus localized surface plasmons: a direct comparison. Nano Lett., 9, 4428-4433(2009).
[35] H. Jung, S. H. Park, J. Lee, B. Lee, J. Park, Y. Seok, J.-H. Choi, M.-G. Kim, C.-S. Song, J. Lee. A size-selectively biomolecule-immobilized nanoprobe-based chemiluminescent lateral flow immunoassay for detection of avian-origin viruses. Anal. Chem., 93, 792-800(2021).
[36] F. Jiao, F. Li, J. Shen, C. Guan, S. A. Khan, J. Wang, Z. Yang, J. Zhu. Wafer-scale flexible plasmonic metasurface with passivated aluminum nanopillars for high-sensitivity immunosensors. Sens. Actuators B, 344, 130170(2021).
[37] M. Yuan, S. Zhan, X. Zhou, Y. Liu, L. Feng, Y. Lin, Z. Zhang, J. Hu. A method for removing self-assembled monolayers on gold. Langmuir, 24, 8707-8710(2008).
[38] J. Zhu, Z. Wang, S. Lin, S. Jiang, X. Liu, S. Guo. Low-cost flexible plasmonic nanobump metasurfaces for label-free sensing of serum tumor marker. Biosens. Bioelectron., 150, 111905(2020).
[39] H. Wang, H. Zhang, J. Dong, S. Hu, W. Zhu, W. Qiu, H. Lu, J. Yu, H. Guan, S. Gao, Z. Li, W. Liu, M. He, J. Zhang, Z. Chen, Y. Luo. Sensitivity-enhanced surface plasmon resonance sensor utilizing a tungsten disulfide (WS2) nanosheets overlayer. Photon. Res., 6, 485-491(2018).


Set citation alerts for the article
Please enter your email address

© Copyright 2018-2021 | Chinese Laser Press. All Rights Reserved 沪ICP备15018463号-20