• Journal of Natural Resources
  • Vol. 35, Issue 1, 174 (2020)
Xiao-lin ZHANG1, Xiao-bin JIN1、2、3、*, Qing-li ZHAO4, Jie REN1, Bo HAN1, Xin-yuan LIANG1, and Yin-kang ZHOU1、2、3
Author Affiliations
  • 1College of Geographic and Oceanographic Sciences, Nanjing University, Nanjing 210023, China
  • 2Key Laboratory of Coastal Zone Exploitation and Protection, Ministry of Natural Resources, Nanjing 210023, China
  • 3Jiangsu Provincial Land Development and Consolidation Technology and Engineering Center, Nanjing 210023, China
  • 4Land Reclamation Center of the Ministry of Natural Resources, Beijing 100035, China
  • show less
    DOI: 10.31497/zrzyxb.20200115 Cite this Article
    Xiao-lin ZHANG, Xiao-bin JIN, Qing-li ZHAO, Jie REN, Bo HAN, Xin-yuan LIANG, Yin-kang ZHOU. Identification and optimization of hierarchical ecological nodes based on multi-target genetic algorithm: Take Jintan district of Changzhou as an example[J]. Journal of Natural Resources, 2020, 35(1): 174 Copy Citation Text show less
    Analysis of ecological nodes
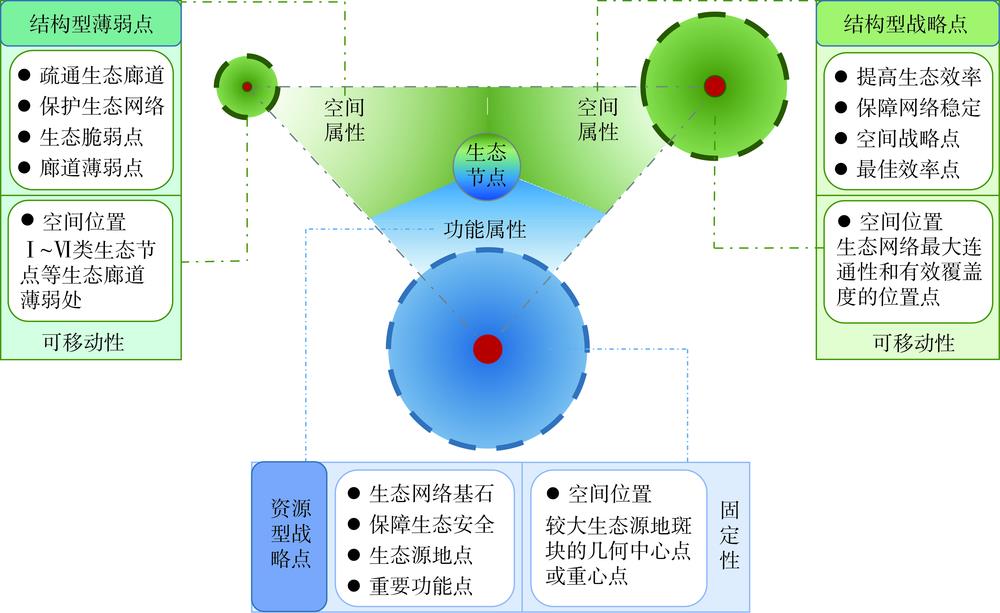
    Fig. 1. Analysis of ecological nodes
    The construction of multi-level ecological nodes
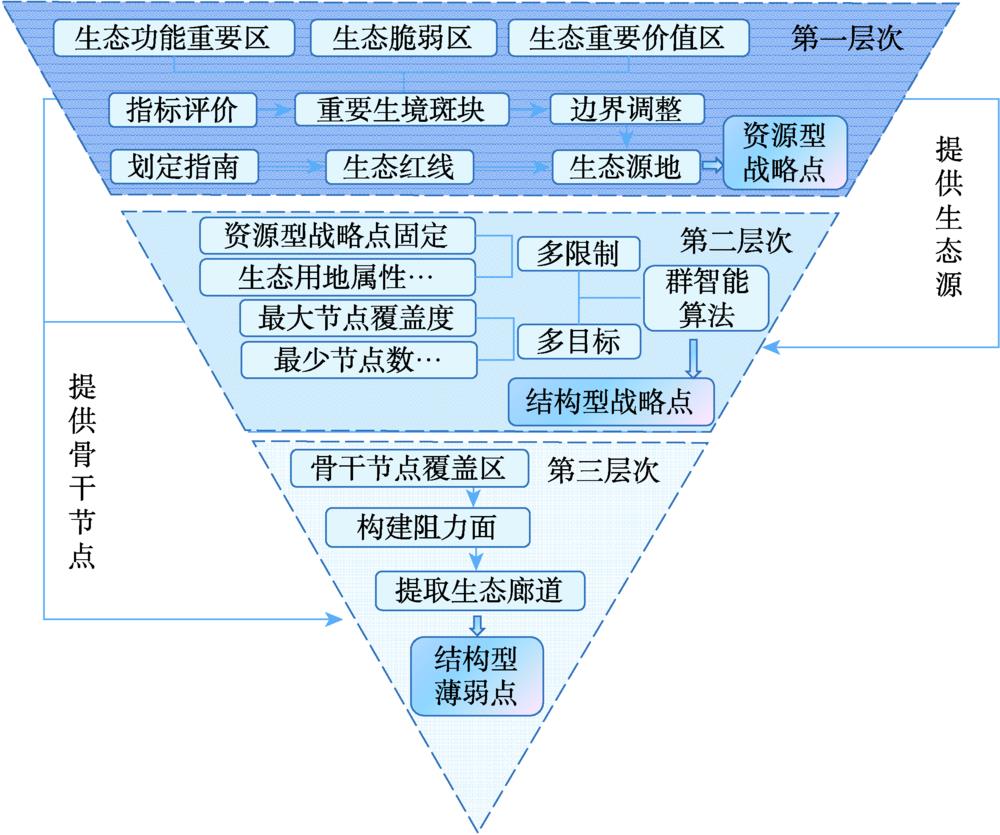
    Fig. 2. The construction of multi-level ecological nodes
    Location of the study area
    Fig. 3. Location of the study area
    The distribution of strategic points and their impact ranges under different initial populations
    Fig. 4. The distribution of strategic points and their impact ranges under different initial populations
    Preliminary ecological network and node distribution in the study area
    Fig. 5. Preliminary ecological network and node distribution in the study area
    Ecological network and node distribution in the study area
    Fig. 6. Ecological network and node distribution in the study area
    数据类型数据产品来源空间分辨率
    土地利用数据土地变更调查数据(2015年)金坛区土地变更调查成果数据库1∶10000
    遥感影像数据Landsat 8 OLI_TRIS(2015年)地理空间数据云30 m
    基础设施数据POI数据(2015年)高德地图API
    江苏省生态保护红线江苏省国家级生态保护红线(2018年)江苏省自然资源厅1∶50000
    DEMASTER GDEM V2版地理空间数据云30 m
    Table 1. Data sources and description
    影响因子类型分级阻力权重
    土地利用类型
    (土地利用阻力)
    林地10.3
    草地4
    其他用地120
    耕地400
    水域400
    道路用地800
    建设用地1000
    植被覆盖度
    (景观格局阻力)
    >0.810.25
    0.6~0.820
    0.3~0.6200
    0.1~0.3500
    <0.11000
    基础设施数量
    (基础设施阻力)
    <4010.25
    40~145200
    145~390700
    >3901000
    距道路中心线距离/m
    (道路阻力)
    100~2002000.2
    50~100500
    <501000
    Table 2. Resistance coefficient and weight assignment for different types
    指标公式描述意义
    节点覆盖率CS1+S2+S3S×100%表征生态节点影响范围面积与区域整体生态用地面积比率。其中S1S2S3为资源型战略点、结构型战略点、结构型薄弱点影响范围;S为区域总面积节点覆盖率越高,代表区域生境斑块联系越紧密,生态网络越稳定。单个生态节点覆盖率越大,生态节点发挥效能越大,反之亦然
    节点分布
    均匀度DE
    节点分布均匀性越低,代表生态节点在研究区内的空间分布越均匀,节点发挥效能越大
    平均节点
    连接数A
    平均节点连接数越大表示通过网络的路径越多,节点发挥效能越大,网络连接越复杂
    平均聚类
    系数CC
    i=1NCC1(i)N
    其中CC1i=2E1(i)/(ki(ki-1))
    N为整个网络中节点数;CC1(i)为节点i的聚类系数;ki为节点i的邻居;E1(i)为ki节点实际存在的边数;ki(ki-1)/2为理论上最大边数平均聚类系数越高,表明在生态网络格局中景观生态流的流动性越强,生态网络更稳定
    网络连通性Ji=1nmi/Nmi为第i节点所邻接的边数网络的连通性越高,其稳定性越好
    网络密度D2MN(N-1)M为网络中实际连接数复杂网络中节点之间连接的紧密性
    Table 3. Indicators for ecological network performance analysis
    初始种群
    个数/个
    节点覆盖
    面积/km2
    平均节点
    覆盖率/%
    节点
    连通率/%
    Pop=50625.151.2896.00
    Pop=30473.951.6286.67
    Pop=20231.031.1870.00
    Pop=10125.061.2850.00
    Table 4. Comparison of different resource-based strategic points
    初级生态
    网络
    节点覆盖率C/%节点分布均匀度DE平均节点连接数A平均聚类系数CC网络连通性J网络密度D
    N128.3620.1742.7240.4294.9380.159
    N248.5740.0993.1540.4415.1250.165
    Table 5. Comparison of preliminary ecological network evaluation results
    生态
    网络
    节点覆盖率C/%节点分布均匀度DE平均节点连接数A平均聚类系数CC网络连通性J网络密度D
    N175.6080.0221.1510.1822.2820.006
    N293.3050.0121.1200.3412.2110.005
    Table 6. Comparison of ecological network evaluation results
    Xiao-lin ZHANG, Xiao-bin JIN, Qing-li ZHAO, Jie REN, Bo HAN, Xin-yuan LIANG, Yin-kang ZHOU. Identification and optimization of hierarchical ecological nodes based on multi-target genetic algorithm: Take Jintan district of Changzhou as an example[J]. Journal of Natural Resources, 2020, 35(1): 174
    Download Citation