
Xiaochang CAO, Xiaojie LIU, Shengkui CHENG, Yao LIU, Panpan ZHANG. A Study of Food Waste in the Catering Industry in Beijing[J]. Journal of Resources and Ecology, 2020, 11(6): 562
- Journal of Resources and Ecology
- Vol. 11, Issue 6, 562 (2020)
Abstract
1 Introduction
Nowadays, food waste has gradually become a focus of research globally, and topics related to the influences and consequences of food waste are especially prevalent. Generally, studies about food waste have two main characteristics. Firstly, many of them are conducted in developed countries and emphasize household waste and food consumption (
China has a large population but only limited per capita arable land. Over the past few decades, China has invested a great deal of resources in improving the yields of arable land (
In order to find solutions for reducing food waste in China, the amounts, structures, and characteristics of food waste should be known. Current food waste studies in China are mainly on the theoretical level, focusing on the concept and progress of food waste (
In this paper, we use the method of field investigation to study the amount and the factors influencing food waste in the catering industry in Beijing. Based on the outcome, we then calculate the waste in terms of resources and environmental impacts. This study provides a method to calculate food waste accurately and an approach for studying the influences of various factors on food waste. It serves as an important test case and represents progress in food waste research outside of the theoretical stage. We hope to support subsequent studies and possibly influence the city’s governance to achieve a reduction in food waste.
2 Research method
2.1 Data collection
This study is based on data collected in July 2013 in Beijing, with a total of 2564 samples from 124 restaurants. The sample selection includes three steps. First, stratified sampling is used to select the sample districts in Beijing. Of the 16 districts, we selected Dongcheng, Haidian and Changping districts to represent the inner ring area, middle ring area and outer ring area. Second, the restaurants in the three districts are selected. We categorize restaurants into large, middle, and small sizes, and use a random method to select individual restaurants. The numbers of large, middle and small restaurants surveyed in Dongcheng are 11, 23, and 18, respectively, while those in Haidian and Changping number 21, 42, 57 and 8, 22, 45, respectively. The last step is to select the samples in each restaurant. We use the isometric method according to the total number of customers in each restaurant within a day, the rate of rejection, and the expected sample number.
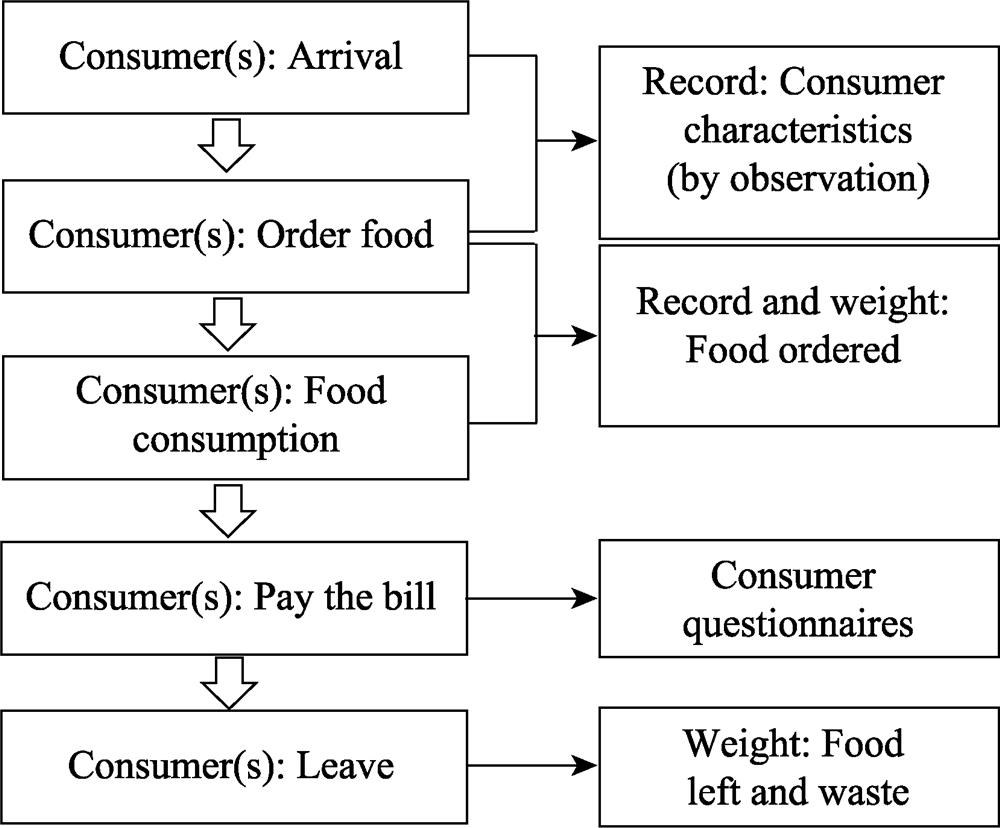
In this survey, the data for each sample is collected in three parts. The first is face-to-face consumer questionnaires, to obtain information about the consumer’s age, employment, education level, income, and the dining reasons. The second part is the information recorded by the investigators, including the number of dishes, each consumer’s characteristics (height, weight, age and gender), whether packaging is involved or not, dining time, the price of each dish, and other factors. The third part is the weight of each dish recorded by the investigators, including the total weight of each dish before and after consumption and the weight of each category of food after consumption (
![]()
Figure 1.
In this study, three aspects are adopted to ensure the reliability of the data. First, the standard for selecting the investigators is strict. Investigators must have former research experience, and each of them was selected based on interviews. Second, before the formal investigation, we carried out training of the investigators, including the explanations of the questionnaire, the survey process, and scene simulation. Third, investigators must have the ability to communicate and cooperate with the restaurant staff. Fourth, in different stages, we used electronic scales to weigh each dish to ensure the accuracy of the investigation.
The materials used for different dishes varied greatly, as did the cooking methods. To facilitate the calculation and analysis, we made a food/material classification table (
| Food | Materials | Cooking methods |
|---|---|---|
| Principal foods | Rice, wheat, peanut, corn and others, usually in the form of soup, noodles, bread or dumplings | Steam, |
| Meats | Pork, beef, mutton, chicken, duck and others, including three sorts: pure meat, ribs and offal | |
| Aquatic products | Fish, shrimp, crab, shellfish and others | |
| Vegetables | Root/melon/bulb/leaf/aquatic/permanent vegetables, cabbage, brassica, mustard, solanaceous, potato, mushroom, beans & bean products and others | |
| Eggs | Chicken eggs and other eggs | |
| Dairy | Milk, dairy products and others |
Table 1.
Food /material classification
2.2 Food waste amount estimation
We calculated the total amount of food waste based on food waste per capita per meal using the following equation:
where
The data from the investigation on food waste in 2012 in Beijing are also used to calculate the per-capita food waste amount. The calculation of food waste generated by tourists in Beijing is based on the number of tourists, per-capita traveling duration, the rate of eating in restaurants and the per-capita food waste amount. According to the “Basic Facts and Figures of Travel and Tourism of Beijing 2013” conducted by the Beijing Municipal Commission of Tourism Development, the number of tourists traveling to Beijing is 147.55 million person-trips annually and the per-capita traveling duration is 4.82 days. Since tourists are non-residents, their rate of eating “outside the home” is considered to be 100%. The per-capita food waste amount is calculated based on the data from the investigation of food waste in 2013 in Beijing.
2.3 Food waste environmental and resources effect estimation
The concept of food waste represents more than just the food which has been wasted. Besides the food itself, the resources consumed to produce the food should also be taken into consideration in the total loss of resources. Some studies evaluate this resource loss through the water footprint and ecological footprint (
where ${{F}_{\text{w}}}$ is the total loss of cereals of food waste in the Beijing catering industry; ${{W}_{i\text{T}}}$ is the direct loss of cereals from the food waste in the catering industry in Beijing; ${{W}_{\text{gT}}}$ is the indirect loss of cereals from the food waste in the Beijing catering industry including vegetables, meats and so on; and ${{\alpha }_{\text{g}}}$ is a grain equivalence coefficient (
where ${{R}_{\text{w}i}}$ is the loss of agricultural resources due to food waste in the Beijing catering industry;${{R}_{i\text{T}}}$ is the total input of agricultural resources in Beijing; and${{A}_{\text{T}}}$is the total area of arable land in Beijing. In this study, agricultural resources refer to Total Agricultural Machinery Power (TAMP), Rural Electricity Consumption (REC), and Consumption of Chemical Fertilizers (CCF).
3 Results
3.1 Amount and structure of food waste
There are three key indicators for each sample: The amount of ordered food, the amount of consumed food, and the amount of leftovers. The first and last indicators are directly recorded by the investigators, and the amount of consumed food is calculated from the other two indicators. Meanwhile, food waste does not equal the amount of leftovers, because there are some inedible parts. Thus, we also calculated the amount of food waste and the food waste rate.
According to the results of the calculation, urban residents in Beijing order 1994.61 g food and left behind 378.44 g food, for an 18.97% food waste rate per meal. According to the survey, there are 2.45 persons at each table on average. Excluding all of the inedible parts, the per-capita amount of food waste per meal is 75.02 g (raw), and the food waste occurs at a rate of 10.52% (
![]()
Figure 2.
According to the classification of the food/ingredients, we analyzed the amount of each material used for cooking. The results show that vegetables and meat (pork, beef and mutton) are wasted the most, making up 41% and 20.18% of the total waste, respectively. Grains (rice, wheat and maize), tubers and aquatic products also make up more than 10% of the total waste, at 12.48%, 11.72% and 11.17%, respectively. Beans and eggs make up about 3% of the total waste (
![]()
Figure 3.
In terms of meat, the largest amount of wastage comes from pork, followed by poultry meat. The amounts of wasted beef and mutton are relatively small (
3.2 Characteristics of food waste
3.2.1 Consumer number and gender
All the guests sitting around one table and sharing food from the same dishes are the traditions of Chinese food culture. Thus, the number of consumers at a table is an important factor to consider. According to this research, 91.18% of samples include 4 or fewer consumers. The results show that with the increasing of the number of consumers at a table, the amount of food waste first increases and then declines (
![]()
Figure 4.
This study also selects samples to compare the generation of food waste by gender. Consumers eating alone are selected as the samples. The results show that males waste more food than females, and the amounts are 61.99 g person-1 per meal and 40.32 g person-1 per meal, respectively (
![]()
Figure 5.
3.2.2 Types of restaurants
We categorize restaurants into four types according to their areas: small-sized restaurants (Sr), medium-sized restaurants (Mr), large-scale restaurants (Lr) and fast food restaurants (Ff), with areas of 30-50 m2, 50-150 m2, >150 m2 and < 30 m2, respectively1.
Among the various types of restaurants, large-scale restaurants generate food waste the most, at 94.01 g per capita. This amount is much higher than the per-capita food waste of 75.02 g in the previous investigation. The per-capita food waste generated in medium-sized restaurants is less than the waste in large-scale restaurants, but more than in small-sized restaurants. Fast food restaurants have the smallest amount of per-capita food waste, at 34.01 g per capita (
![]()
Figure 6.
To make this research more precise, the food waste rate is also calculated. Considering the amount of food that is ordered and consumed in large restaurants, although the amount of food wasted is highest, the food waste rate is not. The results show that there are higher rates of food waste in Mr and Sr. The potential factors driving these differences might be the different skill levels of cooks and sanitary differences between different categories of restaurants. In our investigation, large restaurants had the best sanitary conditions. Only 2.38% of large restaurants are sanitary classified as C (where C stands for average), the rest are A or B (where A stands for excellent). In contrast, 51.85% of small restaurants had sanitary conditions of C. 2
3.2.3 Age
Among the investigated samples, consumers mainly belong to two age groups: From 21 to 30 and from 31 to 40. In the investigation, only a few consumers were aged below 20 or above 61, which is consistent with the current situation of eating in restaurants by residents (
![]()
Figure 7.
3.2.4 Educational level
Generally, the food waste is reduced when the consumers’ educational level increases. The results show that consumers with primary and secondary school education waste more than 100 g food per capita per meal, while consumers with higher education levels waste less than 80 g food per capita per meal (
![]()
Figure 8.
3.2.5 Consumption motivations
In the survey, we classified consumption motivations into five types, which are public/business consumption, family parties, friends’ parties, working meals, and others. The results show that friends’ parties and public/business consumptions waste more food, at 106.15 g person-1 per meal and 80.92 g person-1 per meal, and the food waste rates are 12.89% and 11.91%, respectively. There is less food waste in family parties and working meals, at 61.08 g person-1 per meal and 58.32 g person-1 per meal, or 8.85% and 9.93% food waste rates, respectively (
![]()
Figure 9.
3.3 The amount of food waste and its resource environmental effects
According to the calculation, the total amount of food waste in the urban catering industry in Beijing is about 417.92 thousand tons per year. Of that amount, the total amount of food waste generated from local residents’ eating out in Beijing is about 282.51 thousand tons per year, and the amount of food waste generated by tourists in Beijing is about 135.41 thousand tons per year. Considering the inedible food components, such as soap and seasoning, the food left behind totals about 833.84 thousand tons per year.
The results show that the food waste in the catering industry in Beijing is equivalent to a loss of 765.53 thousand tons of cereals, which means that 79.66% of the total cereals yield in Beijing is wasted. From the perspective of environmental loss, this represents a loss of 166.12 thousand ha arable land (
| Types of | Arable land | Cereals | TAMP | REC | CCF |
|---|---|---|---|---|---|
| Cost of food waste | 166.12 | 765.53 | 1562.12 | 3649.98 | 96.24 |
Table 2.
The costs of agricultural resources of food waste in the Beijing catering industry
Considering that the production of different food types needs various resource inputs, we calculate the proportions of different types of food and evaluate the environmental losses of each type. The results show that the beef and mutton, pork, and poultry meat wasted contribute the most, which make up 34%, 26%, and 12% of the total loss. Although vegetables make up a larger proportion of food waste, the environmental loss it contributes is less than 2% of the total loss (
![]()
Figure 10.
4 Discussion and conclusions
4.1 Discussion
This paper uses first-hand data from consumer questionnaires and food waste weighing in restaurants in Beijing. The data support the quantitative analysis of food waste and guarantee the accuracy and scientific validity of the results. Therefore, this study is meaningful for the food waste research field internationally. For further studies, the following three issues need to be addressed.
(1) How much food is wasted in China?
In this paper, we evaluated the amount of food waste in the catering industry in Beijing. For further study, spatial variations need to be considered. China has a great diversity of cultures and natural products, and people in different areas have different food preferences and dietary patterns. This means that the amounts and structures of food waste are expected to vary among different areas and districts.
Secondly, the catering industry is only one part of the food consumption system. To evaluate the comprehensive situation of food waste, food consumption at home and canteens also need to be included. Additionally, tourists bring more food waste (
Thirdly, food waste happens at every stage of the food supply chain (
(2) What are the costs of generating food waste?
Food waste can lead to series of consequences. According to the FAO, 9.2% of the world’s population was exposed to severe food insecurity in 2018 (
(3) How can food waste in China be reduced?
All of the stages in the food supply chain are generating food waste (
Food waste is not merely an issue of food production and consumption, but also a problem of society and culture. To reduce food waste, we need to combine the efforts of different stakeholders, such as governors, researchers, catering industry associations, enterprise operators and consumers, to take advantage of the means of policy, technology, culture and so on. A comprehensive approach is necessary to reduce food waste.
4.2 Conclusions
Based on a field survey, this study made a quantitative analysis of food waste in the catering industry in Beijing. It generated the following conclusions:
(1) The per-capita food waste is about 75.02 g person-1 per meal in the catering industry in Beijing, with a 10.52% food waste rate.
(2) Vegetables make up the highest proportion of food waste, followed by meats, aquatic food and grains.
(3) The amounts of food waste vary with the number of consumers sharing food together, the types of restaurants, and consumers’ genders, ages, educational levels, and consumption motivations.
(4) The total amount of food waste in the urban catering industry in Beijing is about 417.92 thousand tons per year, among which the urban residents waste about 282.51 thousand tons per year, and tourists waste about 135.41 thousand tons per year.
(5) The food waste generated in the catering industry in Beijing is equivalent to a loss of 765.53 thousand tons of cereals or 166.12 thousand ha of arable land. Meats make up the largest proportion of the environmental losses.
References
[2] Cao ZH. Changes in Chinese food consumption and agricultural production requirements based on cereal equivalent. Resources Science, 35, 2181-2187(2013).
[3] Cheng SK, Gao LW, Xu ZR et al. Food waste in catering industry and its impacts on resources and environment in China. China Soft Science, 106-114(2012).
[6] FanX, ZhangW, Chen WW et al. Land-water-energy nexus in agricultural management for greenhouse gas mitigation. Applied Energy, 265, 1-11(2020).
[8] et alThe state of food security and nutrition in the world 2019. Safeguarding against economic slowdowns and downturns. Rome: FAO.(2019).
[9] Food loss prevention in perishable crops. Rome: Food and Agriculture Organization of the. United Nations.(1981).
[10] Food wastage footprint impacts on natural resources-summary report. Rome: FAO.(2013).
[13] Gao LW, Cheng SK, Cao XC et al. Review of food loss and waste research and its prospects. Journal of Natural Resources, 30, 523-536(2015).
[14] GustavssonJ, CederbergC, SonessonU et al. Global food losses and food waste. Food and Agricultural Organization of the Unite Nations, Rome(2011).
[17] Kantor, LindaS, Lipto et al. Estimating and addressing America’s food losses. Food Review, 20, 2-12(1997).
[20] LyndhurstB. Helping consumers reduce food waste—A retail survey 2011. Final report, Waste and Resources Action Program, Banbury, UK.(2012).
[22] NorseD, Ju XT. Environmental costs of China’s food security. Agriculture, Ecosystems and Environment, 209, 5-14(2015).
[24] Raife MY, Ay?enC. Factors affecting food waste at the downstream entities of the supply chain: A critical review. Journal of Cleaner Production, 244, 1-26(2020).
[28] Wang LE, Cheng SK, LiuG et al. Study on theories and methods of Chinese food waste. Journal of Natural Resources, 30, 715-724(2015).
[30] Wei LY, Li ZH, Sun JT et al. Pollution characteristics and health risk assessment of phthalate esters in agricultural soil and vegetables in the Yangtze River Delta of China. Science of the Total Environment, 726, 1-8(2020).
[33] Household food and drink waste in the UK. Final Report, Waste and Resources Action Programme, Banbury, UK.(2009).
[34] Waste arisings in the supply of food and drink to households in the UK. Final report, Waste and Resources Action Program, Banbury, UK.(2010).
[35] ZhangD, Cheng SK, Gao LW et al. The carbon footprint of catering industry food waste: A Beijing case study. Acta Ecologica Sinica, 36, 5937-5948(2016).
[37] ZhangD, LunF, Cheng SK et al. The phosphorus footprint and its environmental analysis for restaurant food waste: Taking Beijing as an example. Journal of Natural Resources, 31, 812-821(2016).
[38] ZhangD, LunF, Cheng SK et al. The nitrogen footprint of different scales of restaurant food waste: A Beijing case study. Acta Ecologica Sinica, 37, 1699-1708(2017).
[39] Zhang PP, Wang LE, Bai JF et al. The food waste behavior of catering consumers from a tourism perspective. Journal of Natural Resources, 40, 1186-1195(2018).


Set citation alerts for the article
Please enter your email address

© Copyright 2018-2021 | Chinese Laser Press. All Rights Reserved 沪ICP备15018463号-20