Abstract
We fabricate a tapered fiber coupler, position it near an ultrahigh- resonator made from a microdroplet, and experimentally measure stimulated Raman emission. We then calculate the molecular vibrational mode associated with each of the Raman lines and present it in a movie. Our Raman laser lines show themselves at a threshold of 160 μW input power, the cold-cavity quality factor is 250 million, and mode volume is . Both pump and Raman laser modes overlap with the liquid phase instead of just residually extending to the fluid.1. INTRODUCTION
The ability of liquids to dissolve, immerse, or contain analytes in a small volume of fluid allows for the detection of nanoparticles [1,2] and molecules [3], as well as the sensing of bio-analytes such as viruses [4] and proteins [5]. An optical cavity submerged in a liquid that contains an analyte [6–8] is typically at the heart of the optical-interrogation experiment since it assists resonantly enhanced detection schemes. Later, such cavities were activated as laser emitters [9–14] to further enhance sensitivity. Generally speaking, the laser-enhanced sensitivity relies on the Schawlow–Towens narrowing [15] mechanism that turns the laser linewidth narrower when compared with the cold-cavity linewidth. Additional enhancement of the sensitivity is by a differential detection scheme whereby noise is canceled out. Such detection relies on a split mode, where the split is affected by the analyte while being relatively immune to noises such as the ones originating from thermal drifts [16]. In more detail, two absorption dips of a split mode [17,18] are measured [4–11,17–23] while considering only the drift of one dip with respect to the other, which is proportional to signal (the analyte). At the same time, noise-induced drifts that occur to both dips are subtracted from one another to cancel themselves out.
Using Raman lasers [9–11,24] for such sensors [25] is beneficial due to the fact that there is no need to dope the dielectric for achieving laser emission. Raman lasers in silica resonators [25] typically benefit from a high optical quality factor, were demonstrated in free-spaced coupled resonators [26], benefit surface enhancement [27], and can continuously monitor chemical reactions in situ [28]. It is therefore natural to consider fabricating most of the system from liquid [9,29–33] that can accept analytes such as nanoparticles [34], including at the region in space where the power of the Raman laser is maximal. In this regard, liquids have Raman gain that makes them proper for dopant-free ultrahigh- Raman lasers [9,30,31]. Furthermore, droplets were recently activated as ultrahigh- resonators while benefitting from being fiber-coupled and operating continuously in time (CW) [35–42]. Also, high index contrast between the liquid and its air-cladding benefits total internal reflection near the air–liquid interface with minimal radiation loss [43,44], while uniquely confining light to overlap almost entirely with the liquid core. A droplet laser could thereby benefit from several advantages, among them small losses by radiation [43,44] and scattering [45], and tight confinement of light to almost entirely overlap with the liquid. Here, we experimentally report on Raman laser emission from a liquid-walled optofluidic device in the form of a droplet resonator coupled to a tapered fiber.
2. FABRICATION
To fabricate the fiber-coupled droplet resonator (Fig. 1), we dipped standard silica fiber with a fused ball on its end into a vessel containing silicone oil (polydimethylsiloxane) with a refractive index of 1.403.
Sign up for Photonics Research TOC. Get the latest issue of Photonics Research delivered right to you!Sign up now
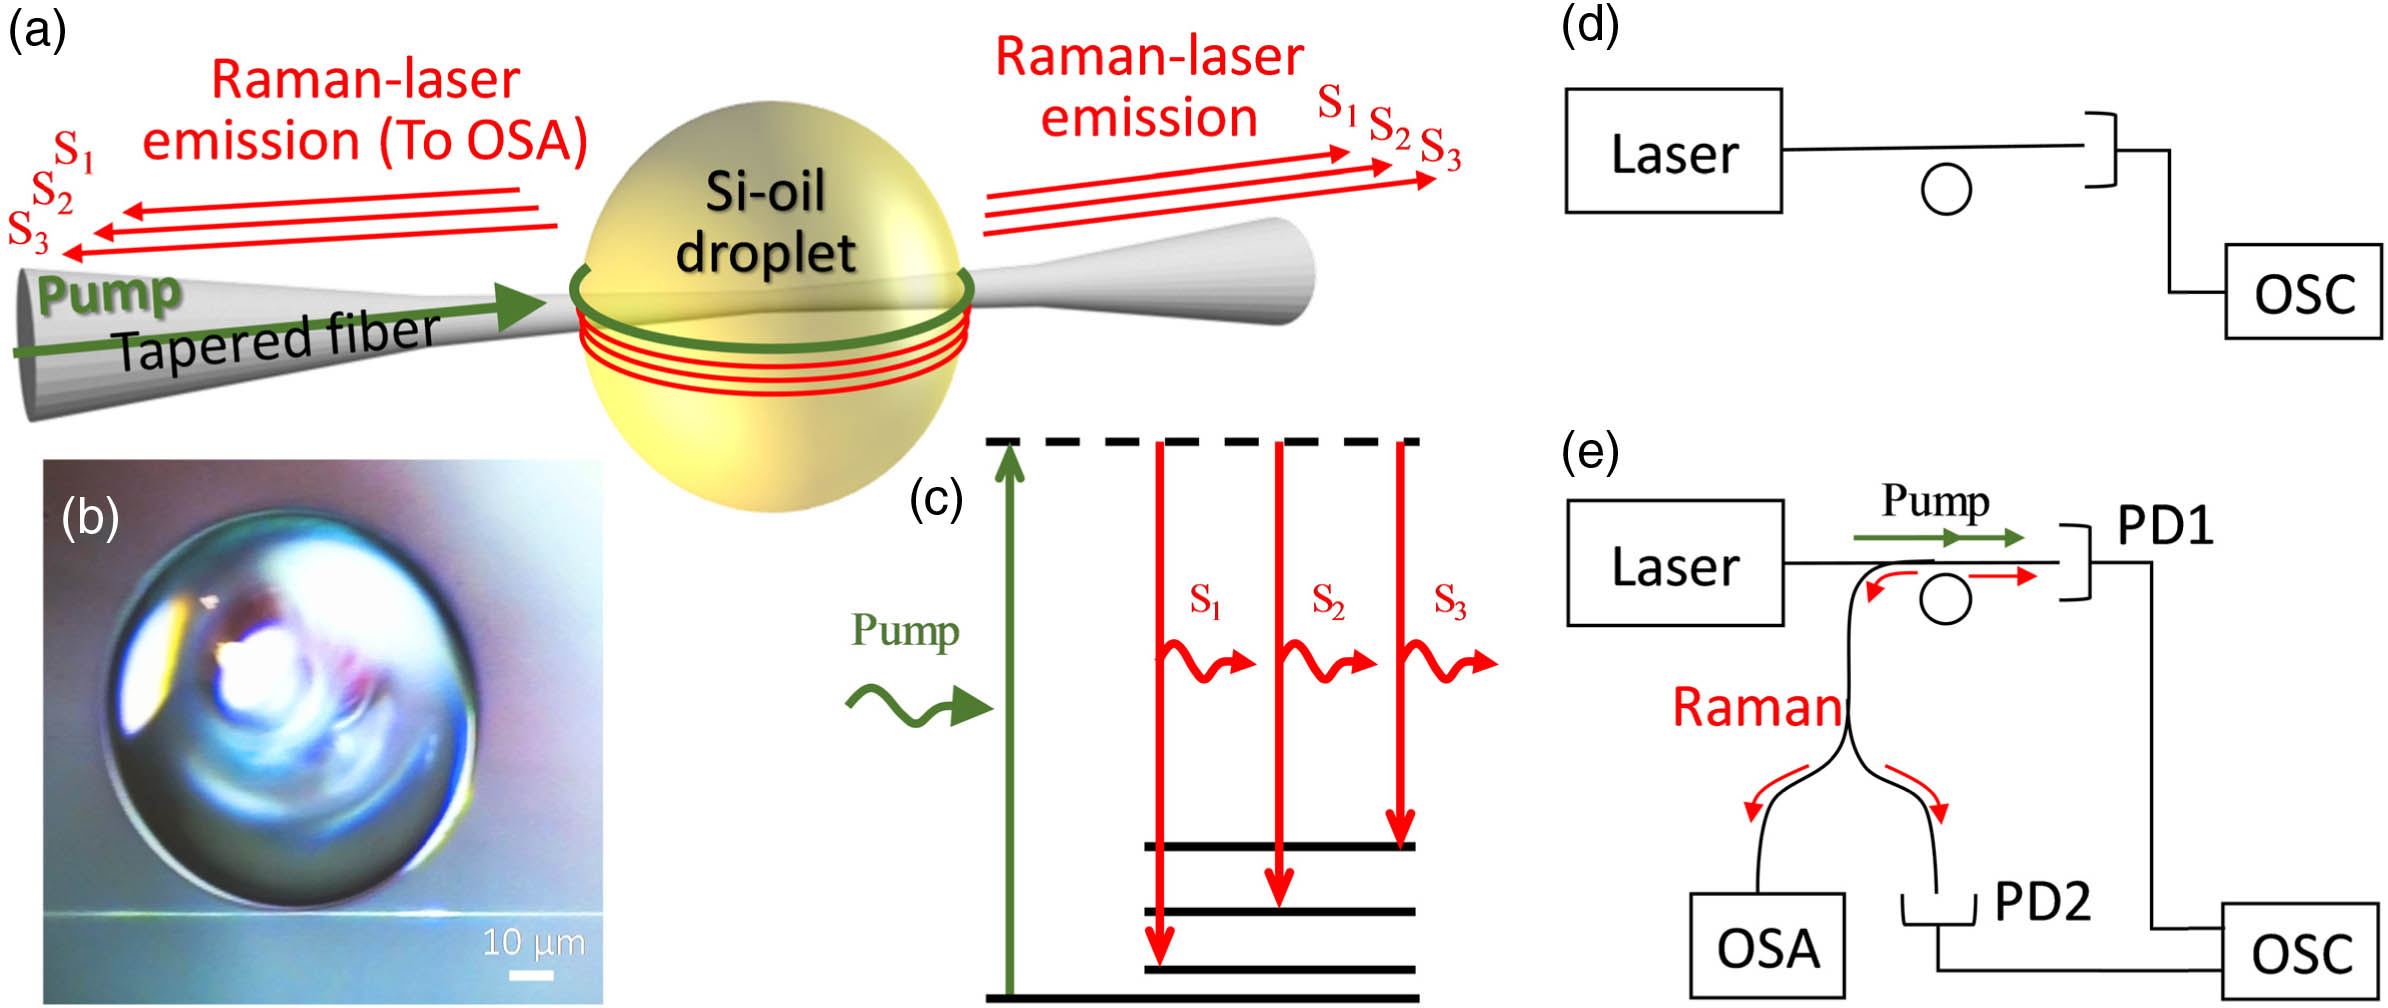
Figure 1.Experimental setup. (a) Coherent emission of multiple Raman laser lines from a liquid droplet resonator. The green arrow represents the pump; red arrows represent forward and backward stimulated Raman emission. (b) Micrograph of our 78 μm diameter silicone oil droplet coupled to a tapered fiber (shown below). (c) Energy-level diagram illustrating three states involved in the Raman spectra. (d) Experimental setup for characterizing the resonator’s optical quality factor by slowly scanning the laser frequency through resonance and measuring the bandwidth of the depth in the transmission. Also, fast scan through resonance similarly allows measuring of the optical quality, but at the temporal domain, relying on the optical ringdown effect. (e) Experimental setup for measuring Raman laser, where the backward Raman laser is directed to an optical spectrum analyzer (OSA) and to a photodetector (PD).
3. ACTIVATION
Activation of the droplet as an optical resonator is done by evanescently coupling light to it using a tapered fiber [46,47] [Figs. 1(a), 1(b), 1(d), and 1(e)]. The same tapered fiber is used, from both of its sides, to similarly couple the laser emission out. We prefer to measure Raman scattering in the backward direction [Fig. 1(e)] in order to minimize noise originating from the pump. The scanning laser is a tunable 770–780 nm laser having a 300 kHz linewidth. We monitor the droplet Raman laser at the 700–1700 nm spectral span using an optical spectrum analyzer.
4. EXPERIMENTAL RESULTS
Characterization of the droplet optical quality is done by fast-scanning the laser frequency through the droplet resonance frequency and measuring the photon lifetime as indicated by its exponential decay [Fig. 2(a)]. This measurement, generally referred to as a ringdown measurement, provides a quality factor of 250 million. Repeating this measurement at the frequency domain by measuring the resonance linewidth [Fig. 2(b)] provides a quality factor of 160 million, which is 36% lower when compared to the measured using the ringdown technique. Differences in were reported in the past to originate from the intra-resonator power [48] and coupling condition [47], as well as from thermal effects [16]. In order to prevent such broadening [16,47,48], we set the circulating power in our measurements to be the lowest we could use by going undercoupled and reducing the pump-laser power.

Figure 2.Measuring the optical quality factor. (a) Scanning the pump laser through one of the resonances charges the resonator with light that decays later on. We fit an exponential decay (red) to provide the photon lifetime and measure a quality factor of 250 million. (b) Repeating this measurement in the frequency domain, while scanning relatively slowly, reveals a of 160 million. We find measurement in (a) more reliable since it is proof against broadening mechanisms.
We experimentally measure the power and spectral characteristic of the Raman laser through the coupled fiber by connecting them to an optical spectrum analyzer (Advantest Q8384) and photodiode, as explained in Fig. 1(e). A circulator is used to extract the backward Raman-laser from the fiber that brings the pump in, and direct it to both an optical spectrum analyzer [Fig. 1(e), OSA] and a detector [Fig. 1(e), PD2]. At the same time, we couple the forward Raman laser out through the other side of the fiber to another detector [Fig. 1(e), PD1]. In order to optimize the output power of the droplet Raman laser, we tune coupling by changing the gap between the fiber and droplet using a nanopositioning system until the Raman laser power, as measured with PD2, gets to a global maximum. The value of this coupling, where laser power is maximal, is generally referred to as optimal coupling [49]. As expected, an optimal coupling shows itself at the slightly undercoupled regime [10,50].
The coupling of both pump and Raman laser is achieved by the same fiber taper, covering from 770 to 1230 nm. This raises the question of how such a broadband phase-matching condition is accomplished. Assuming phase matching for 770 nm and coupling length of 5 μm [Fig. 1(b)], and using the power-transfer ration for such a coupler [51]: where is the phase mismatch. The coupling efficiency is expected to go down to 91% for the line and to 69% for the line. Yet, by comparing the actual coupling ration [Fig. 5(a)] to the Raman gain [Fig. 5(b)] for the 3000 and lines, we can tell that while the calculated coupling ration is 0.56, the measured one is 0.2. Such deviation can originate from a different chaos-assisted coupling [52] for the two lines.
As one can see in Fig. 3, we measure the power of our Raman laser as a function of the pump power. A knee shape reveals a threshold power of 160 μW for our Raman laser. At this threshold, the Raman gain becomes larger than cavity loss. This knee separates between the spontaneous and stimulated emission regions.
Figure 3.Experimentally measured threshold, power, and efficiency for the microdroplet Raman laser. Raman laser power outcoupled via the fiber, as a function of the pump input power. We fit the experimental data (circles) to the sum of two linear functions; one represents the spontaneous emission, and the other represents the stimulated emission. A knee shape at 160 μW indicates the transition from spontaneous emission to stimulated emission at input power generally referred to as the lasing threshold. The slope efficiency here is 18%. R squared is 0.98 and 0.9995 for the spontaneous and stimulated fits, respectively. The size of the circles corresponds to the resolution of our measurement.
Raman laser spectrum is measured using an optical spectrum analyzer [Fig. 1(e), OSA] to reveal several laser lines [Fig. 4(b)], where each laser line refers to a different vibration mode of the polydimethylsiloxane molecule [Fig. 4(a)]. We change coupling until it is optimized [49], and then measure the Raman spectrum in the backward direction. The vibration modes of the polydimethylsiloxane molecule [Fig. 4(a) and Visualization 1] were calculated using numerical-analysis software (SCM software, ADF module). These calculated molecular-vibration modes fall within the bandwidth of the observed Raman laser lines. The first observed Raman laser line (S1) is related to a transverse vibration mode of the oxygen atoms. The second observed Raman laser line (S2) is related to a vibration mode of the hydrogen atoms. As expected, the higher-rate vibrational mode (S2) originates from the motion of a lighter atom (hydrogen), while the lower-rate optical phonon (S1) relates to the vibration of a heavier atom (oxygen). The third observed mode (S3) is at a high rate that our computation resources could not cover. We estimate the third line (S3) to be involved in a mutual hydrogen molecule vibration, marked by a dashed line in Fig. 4(a).
Figure 4.Experimentally measured Raman laser lines and their corresponding calculated molecular vibrations. (a) We calculate the vibrational modes of polydimethylsiloxane (which include three repeating monomer units) using the ADF module of SCM software. A movie describing the dynamics involved in these S1-2 vibrations appears in the Supplementary Material. Our pump-mode wavelength is 778.2 nm, and its quality factor is 250 million. Our Raman line wavelengths are 792.2, 991.1, and 1230.8 nm.
We also compare the droplet Raman laser spectrum to a measurement done using a commercial Raman spectrometer as a control group experiment. As one can see in Fig. 5, our Raman lines (S1, S2, and an additional low-frequency line) fall within the bandwidth of the lines measured by the commercial device. The high frequency of our third Raman laser line (S3) falls out of the measuring range for the specific spectrometer-detector that we used. Generally speaking, the intensity of the Raman laser lines is proportional to the Raman gain [53] and inversely proportional to material absorption at the wavelength where the relevant laser line is expected [54]. Relatedly, the line with the strongest Raman gain here [Fig. 5(b), near ] has a relatively low-intensity laser line [Fig. 5(a), blue, near ] due to high absorption (by the silicone oil) at this region [54].
Figure 5.Experimental results. (blue) Raman spectrum of 56 μm diameter droplet resonator made from silicone oil with a viscosity of 1000 mPa·s. (black) Control group: Raman spectrum obtained using a commercial Raman spectrometer (Horiba Jobin Yvon LabRAM HR Evolution). The two spectra are provided together (a) for showing the higher power of the stimulated emission, then (b) for zooming in to the control group experiment to provide its finer details. The Raman laser lines near 1000, 3000, and [blue line in (a)] occur in multiple modes.
5. CONCLUSION
Droplets represent one of the simplest and most common forms of liquid in nature, industry, and laboratory processes. The novelty here is in turning such a simple droplet to a fiber-coupled Raman laser. We believe that our droplet micro-laser can be used in the future to react to analytes, among them nanoparticles. Such nanoparticles can either settle at the liquid–air interface [55] or be mixed in the fluid constituting the droplet resonator [42]. We expect both configurations, interface nanoparticle [55] and submerged nanoparticle [42], to affect the Raman laser. It is important to note that our droplet Raman laser relies on silicone oil that has a low vapor pressure and is hence practically non-evaporating. Going to liquids that tend to evaporate might raise some challenges. Among such evaporating liquids, water is most interesting. Water is interesting in this regard of droplet Raman lasers because most bio-analytes prefer an aquatic environment. Recently developed techniques that compensate for evaporation [36,39] might mitigate this drawback to permit Raman lasers in liquids that tend to evaporate at room conditions. In a broader perspective, current techniques in optofluidics rely on solid walls near the liquid. As a result, current optofluidic technology supports only pump and laser resonances that propagate mostly in the solid and only residually in the liquid. Inversely here, the pump and laser modes propagate in the liquid. While such droplet Raman lasers were first demonstrated long ago in droplets that fall near short pulses of light [9], using fiber coupling for both pump and laser light allows a transformation from pulses to a continuous-in-time droplet laser, as well as a coupling method that is compatible with current fiber technology.
Acknowledgment
Acknowledgment. This research was supported by ICore: the Israeli Center for Research Excellence “Circle of Light” grant No. 1802/12, the Israel Science Foundation (2013/15), the Israel Ministry of Science, Technology and Space. We thank Dr. Rachel Edrie for her help with the Raman spectrum measurement.
References
[1] G. Yang, I. M. White, X. Fan. An opto-fluidic ring resonator biosensor for the detection of organophosphorus pesticides. Sens. Actuat. B Chem., 133, 105-112(2008).
[2] T. Lu, H. Lee, T. Chen, S. Herchak, J.-H. Kim, S. E. Fraser, R. C. Flagan, K. Vahala. High sensitivity nanoparticle detection using optical microcavities. Proc. Natl. Acad. Sci. U.S.A., 108, 5976-5979(2011).
[3] F. Vollmer, S. Arnold. Whispering-gallery-mode biosensing: label-free detection down to single molecules. Nat. Methods, 5, 591-596(2008).
[4] L. He, S. K. Ozdemir, J. Zhu, W. Kim, L. Yang. Detecting single viruses and nanoparticles using whispering gallery microlasers. Nat. Nanotechnol., 6, 428-432(2011).
[5] S. Arnold, M. Khoshsima, I. Teraoka, S. Holler, F. Vollmer. Shift of whispering-gallery modes in microspheres by protein adsorption. Opt. Lett., 28, 272-274(2003).
[6] X. Fan, I. M. White. Optofluidic microsystems for chemical and biological analysis. Nat. Photonics, 5, 591-597(2011).
[7] F. Vollmer, L. Yang. Review label-free detection with high-Q microcavities: a review of biosensing mechanisms for integrated devices. Nanophotonics, 1, 267-291(2012).
[8] Y. Fainman, L. Lee, D. Psaltis, C. Yang. Optofluidics: Fundamentals, Devices, and Applications(2009).
[9] J. B. Snow, S.-X. Qian, R. K. Chang. Stimulated Raman scattering from individual water and ethanol droplets at morphology-dependent resonances. Opt. Lett., 10, 37-39(1985).
[10] S. M. Spillane, T. J. Kippenberg, K. J. Vahala. Ultralow-threshold Raman laser using a spherical dielectric microcavity. Nature, 415, 621-623(2002).
[11] J. Moore, M. Tomes, T. Carmon, M. Jarrahi. Continuous-wave cascaded-harmonic generation and multi-photon Raman lasing in lithium niobate whispering-gallery resonators. Appl. Phys. Lett., 99, 221111(2011).
[12] L. Yang, T. Carmon, B. Min, S. M. Spillane, K. J. Vahala. Erbium-doped and Raman microlasers on a silicon chip fabricated by the solgel process. Appl. Phys. Lett., 86, 091114(2005).
[13] B.-B. Li, Y.-F. Xiao, M.-Y. Yan, W. R. Clements, Q. Gong. Low-threshold Raman laser from an on-chip, high-Q, polymer-coated microcavity. Opt. Lett., 38, 1802-1804(2013).
[14] G. Lin, Y. K. Chembo. Phase-locking transition in Raman combs generated with whispering gallery mode resonators. Opt. Lett., 41, 3718-3721(2016).
[15] A. L. Schawlow, C. H. Townes. Infrared and optical masers. Phys. Rev., 112, 1940-1949(1958).
[16] T. Carmon, L. Yang, K. Vahala. Dynamical thermal behavior and thermal self-stability of microcavities. Opt. Express, 12, 4742-4750(2004).
[17] D. S. Weiss, V. Sandoghdar, J. Hare, V. Lefevre-Seguin, J.-M. Raimond, S. Haroche. Splitting of high-Q Mie modes induced by light backscattering in silica microspheres. Opt. Lett., 20, 1835-1837(1995).
[18] A. Mazzei, S. Götzinger, L. D. S. Menezes, G. Zumofen, O. Benson, V. Sandoghdar. Controlled coupling of counterpropagating whispering-gallery modes by a single Rayleigh scatterer: a classical problem in a quantum optical light. Phys. Rev. Lett., 99, 173603(2007).
[19] I. Teraoka, S. Arnold. Resonance shifts of counterpropagating whispering-gallery modes: degenerate perturbation theory and application to resonator sensors with axial symmetry. J. Opt. Soc. Am. B, 26, 1321-1329(2009).
[20] X. Yi, Y.-F. Xiao, Y.-C. Liu, B.-B. Li, Y.-L. Chen, Y. Li, Q. Gong. Multiple-Rayleigh-scatterer-induced mode splitting in a high-Q whispering-gallery-mode microresonator. Phys. Rev. A, 83, 023803(2011).
[21] J. Zhu, S. K. Ozdemir, Y.-F. Xiao, L. Li, L. He, D.-R. Chen, L. Yang. On-chip single nanoparticle detection and sizing by mode splitting in an ultrahigh-Q microresonator. Nat. Photonics, 4, 46-49(2010).
[22] L. Shao, X. Jiang, X. Yu, B. Li, W. R. Clements, F. Vollmer, W. Wang, Y. Xiao, Q. Gong. Detection of single nanoparticles and lentiviruses using microcavity resonance broadening. Adv. Mater., 25, 5616-5620(2013).
[23] Ş. K. Özdemir, J. Zhu, X. Yang, B. Peng, H. Yilmaz, L. He, F. Monifi, S. H. Huang, G. L. Long, L. Yang. Highly sensitive detection of nanoparticles with a self-referenced and self-heterodyned whispering-gallery Raman microlaser. Proc. Natl. Acad. Sci. U.S.A., 111, E3836-E3844(2014).
[24] W. Kiefer, J. Popp, M. Lankers, M. Trunk, I. Hartmann, E. Urlaub, J. Musick. Raman–Mie scattering from single laser trapped microdroplets. J. Mol. Struct., 408, 113-120(1997).
[25] B.-B. Li, W. R. Clements, X.-C. Yu, K. Shi, Q. Gong, Y.-F. Xiao. Single nanoparticle detection using split-mode microcavity Raman lasers. Proc. Natl. Acad. Sci. U.S.A., 111, 14657-14662(2014).
[26] X.-F. Jiang, Y.-F. Xiao, Q.-F. Yang, L. Shao, W. R. Clements, Q. Gong. Free-space coupled, ultralow-threshold Raman lasing from a silica microcavity. Appl. Phys. Lett., 103, 101102(2013).
[27] S. H. Huang, X. Jiang, B. Peng, C. Janisch, A. Cocking, Ş. K. Özdemir, Z. Liu, L. Yang. Surface-enhanced Raman scattering on dielectric microspheres with whispering gallery mode resonance. Photon. Res., 6, 346-356(2018).
[28] S. H. Huang, S. Sheth, E. Jain, X. Jiang, S. P. Zustiak, L. Yang. Whispering gallery mode resonator sensor for in situ measurements of hydrogel gelation. Opt. Express, 26, 51-62(2018).
[29] S. Nie, D. T. Chiu, R. N. Zare. Probing individual molecules with confocal fluorescence microscopy. Science, 266, 1018-1021(1994).
[30] A. Sennaroglu, A. Kiraz, M. A. Dündar, A. Kurt, A. L. Demirel. Raman lasing near 630 nm from stationary glycerol–water microdroplets on a superhydrophobic surface. Opt. Lett., 32, 2197-2199(2007).
[31] H. Latifi, A. Biswas, R. L. Armstrong, R. G. Pinnick. Lasing and stimulated Raman scattering in spherical liquid droplets: time, irradiance, and wavelength dependence. Appl. Opt., 29, 5387-5392(1990).
[32] M. L. Douvidzon, S. Maayani, L. L. Martin, T. Carmon. Light and capillary waves propagation in water fibers. Sci. Rep., 7, 16633(2017).
[33] A. Giorgini, S. Avino, P. Malara, P. De Natale, M. Yannai, T. Carmon, G. Gagliardi. Stimulated Brillouin cavity optomechanics in liquid droplets. Phys. Rev. Lett., 120, 073902(2018).
[34] D. B. David, S. Maayani, L. L. Martin, T. Carmon. Fluidic vortices generated from optical vortices in a microdroplet cavity(2016).
[35] M. Hossein-Zadeh, K. J. Vahala. Fiber-taper coupling to whispering-gallery modes of a droplet resonator embedded in a liquid medium. Conference on Lasers and Electro-Optics, CWI5(2006).
[36] S. Maayani, L. L. Martin, T. Carmon. Water-walled microfluidics for high-optical finesse cavities. Nat. Commun., 7, 10435(2016).
[37] S. Kaminski, L. L. Martin, S. Maayani, T. Carmon. Ripplon laser through stimulated emission mediated by water waves. Nat. Photonics, 10, 758-761(2016).
[38] R. Dahan, L. L. Martin, T. Carmon. Droplet optomechanics. Optica, 3, 175-178(2016).
[39] S. Maayani, L. L. Martin, S. Kaminski, T. Carmon. Cavity optocapillaries. Optica, 3, 552-555(2016).
[40] G. Lin, A. Coillet, Y. K. Chembo. Nonlinear photonics with high-Q whispering-gallery-mode resonators. Adv. Opt. Photon., 9, 828-890(2017).
[41] S. Kaminski, L. L. Martin, T. Carmon. Tweezers controlled resonator. Opt. Express, 23, 28914-28919(2015).
[42] D. Bar-David, S. Maayani, L. L. Martin, T. Carmon. Cavity optofluidics: a μdroplet’s whispering-gallery mode makes a μvortex. Opt. Express, 26, 19115-19122(2018).
[43] C. Vedrenne, J. Arnaud. Whispering-gallery modes of dielectric resonators. IEE Proc. Microw. Antennas Propag., 129, 183-187(1982).
[44] M. Tomes, K. J. Vahala, T. Carmon. Direct imaging of tunneling from a potential well. Opt. Express, 17, 19160-19165(2009).
[45] A. Giorgini, S. Avino, P. Malara, P. De Natale, G. Gagliardi. Fundamental limits in high-Q droplet microresonators. Sci. Rep., 7, 41997(2017).
[46] J. C. Knight, G. Cheung, F. Jacques, T. A. Birks. Phase-matched excitation of whispering-gallery-mode resonances by a fiber taper. Opt. Lett., 22, 1129-1131(1997).
[47] M. L. Gorodetsky, V. S. Ilchenko. Optical microsphere resonators: optimal coupling to high-Q whispering gallery modes. J. Opt. Soc. Am. B, 16, 147-154(1999).
[48] I. S. Grudinin, A. B. Matsko, L. Maleki. On the fundamental limits of Q factor of crystalline dielectric resonators. Opt. Express, 15, 3390-3395(2007).
[49] P. W. Milonni, J. H. Eberly. Lasers(1988).
[50] G. Bahl, K. H. Kim, W. Lee, J. Liu, X. Fan, T. Carmon. Brillouin cavity optomechanics with microfluidic devices. Nat. Commun., 4, 1994(2013).
[51] B. E. A. Saleh, M. C. Teich. Fundamentals of Photonics, 10, 378-382(2007).
[52] X. Jiang, L. Shao, S.-X. Zhang, X. Yi, J. Wiersig, L. Wang, Q. Gong, M. Lončar, L. Yang, Y.-F. Xiao. Chaos-assisted broadband momentum transformation in optical microresonators. Science, 358, 344-347(2017).
[53] T. J. Kippenberg, S. M. Spillane, B. Min, K. J. Vahala. Theoretical and experimental study of stimulated and cascaded Raman scattering in ultrahigh-Q optical microcavities. IEEE J. Sel. Top. Quantum Electron., 10, 1219-1228(2004).
[54] M. Xu, X. Wang, B. Jin, H. Ren, M. Xu, X. Wang, B. Jin, H. Ren. Infrared optical switch using a movable liquid droplet. Micromachines, 6, 186-195(2015).
[55] K. Schwenke, L. Isa, E. D. Gado. Assembly of nanoparticles at liquid interfaces: crowding and ordering. Langmuir, 30, 3069-3074(2014).

